

Bitcoin Bear Market 2026
Survive the Grind - Not Just the Crash

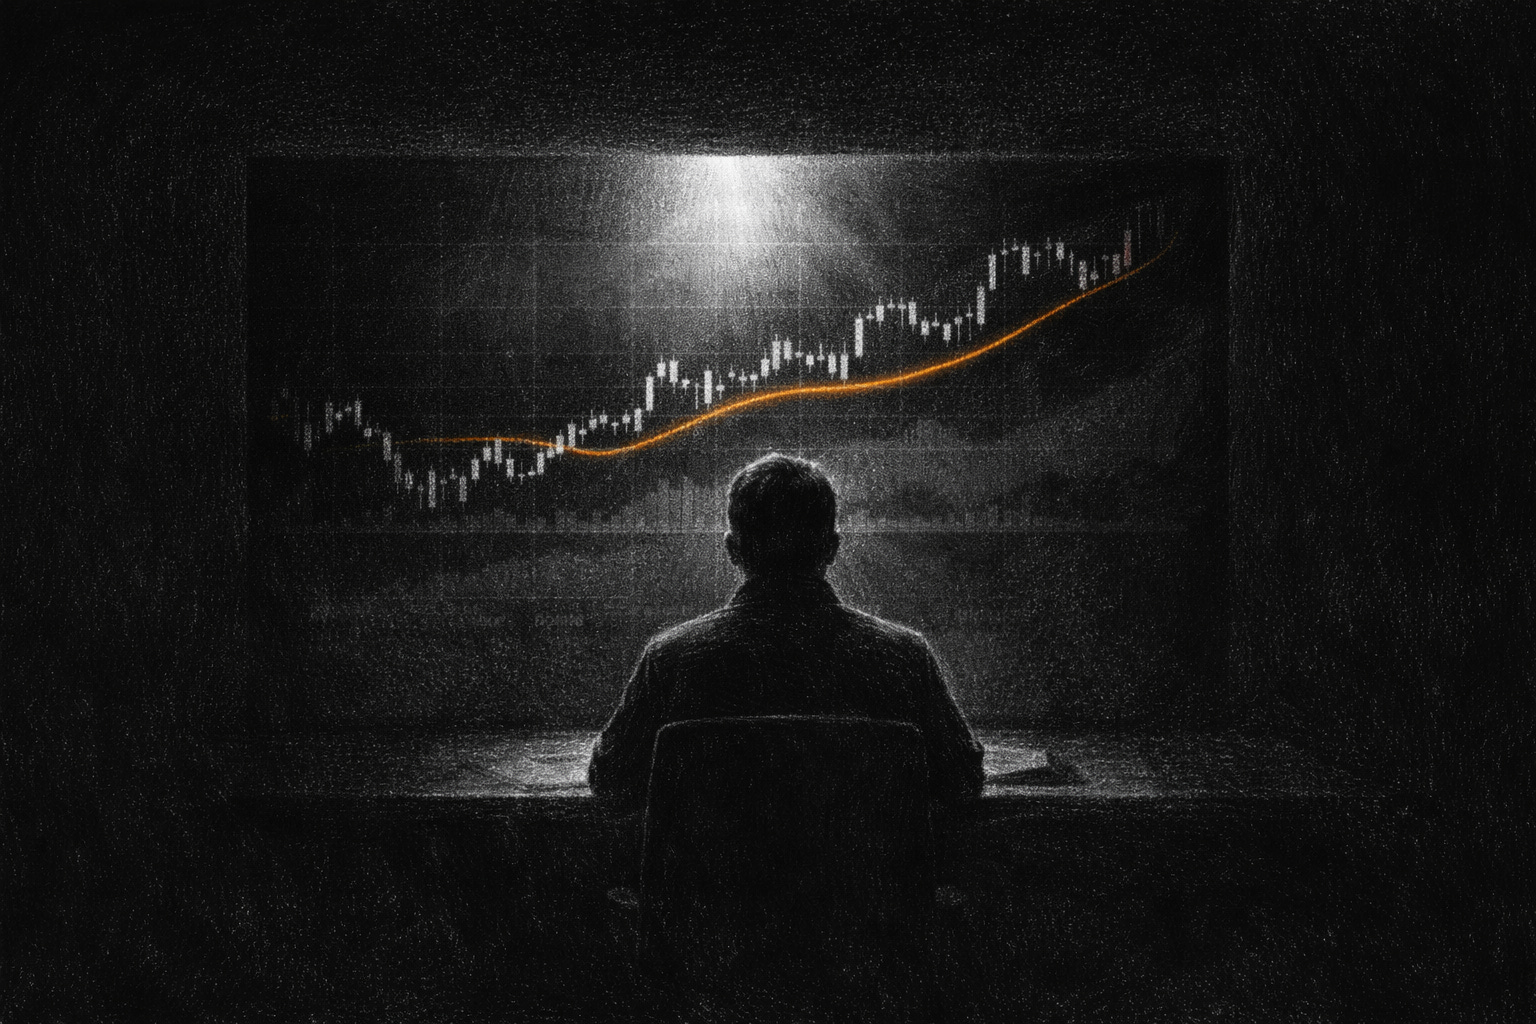
Many Bitcoin investors think the worst part of a bear market is the crash.
It isn’t.
It’s what comes after.
The violent drop toward $60k felt like capitulation. It was fast. It was emotional. It was the kind of move that makes people question everything.
But bear markets don’t end with a single punch.
They end with something slower. More frustrating. More corrosive.
They end with time pain.
And if 2026 is shaping up to be a true Bitcoin bear market, then price pain may already be behind us — but time pain is likely still ahead.
Price Pain vs Time Pain
James Check (Checkonchain) has written extensively about this distinction in several of his recent pieces.
His framework breaks bear markets into two distinct phases:
Price pain – the sharp drawdown, liquidations, and emotional flush.
Time pain – the months-long grind that follows, where the market moves sideways or slowly bleeds, exhausting participants.
The first phase shocks you.
The second phase breaks you.
Historically, Bitcoin has often seen an initial capitulation low, followed by a prolonged period of chop before either:
A secondary, deeper capitulation, or
A slow base that eventually turns into recovery.
If $60k was the price capitulation event, then the uncomfortable possibility is this:
The bear market is not over. It’s transitioning phases.
The Three Zones That Matter
Below is my weekly Bitcoin chart on TradingView, with zones derived from advanced on-chain analytics from the great James Check from Checkonchain.
Chart 1: Structural Value Zones
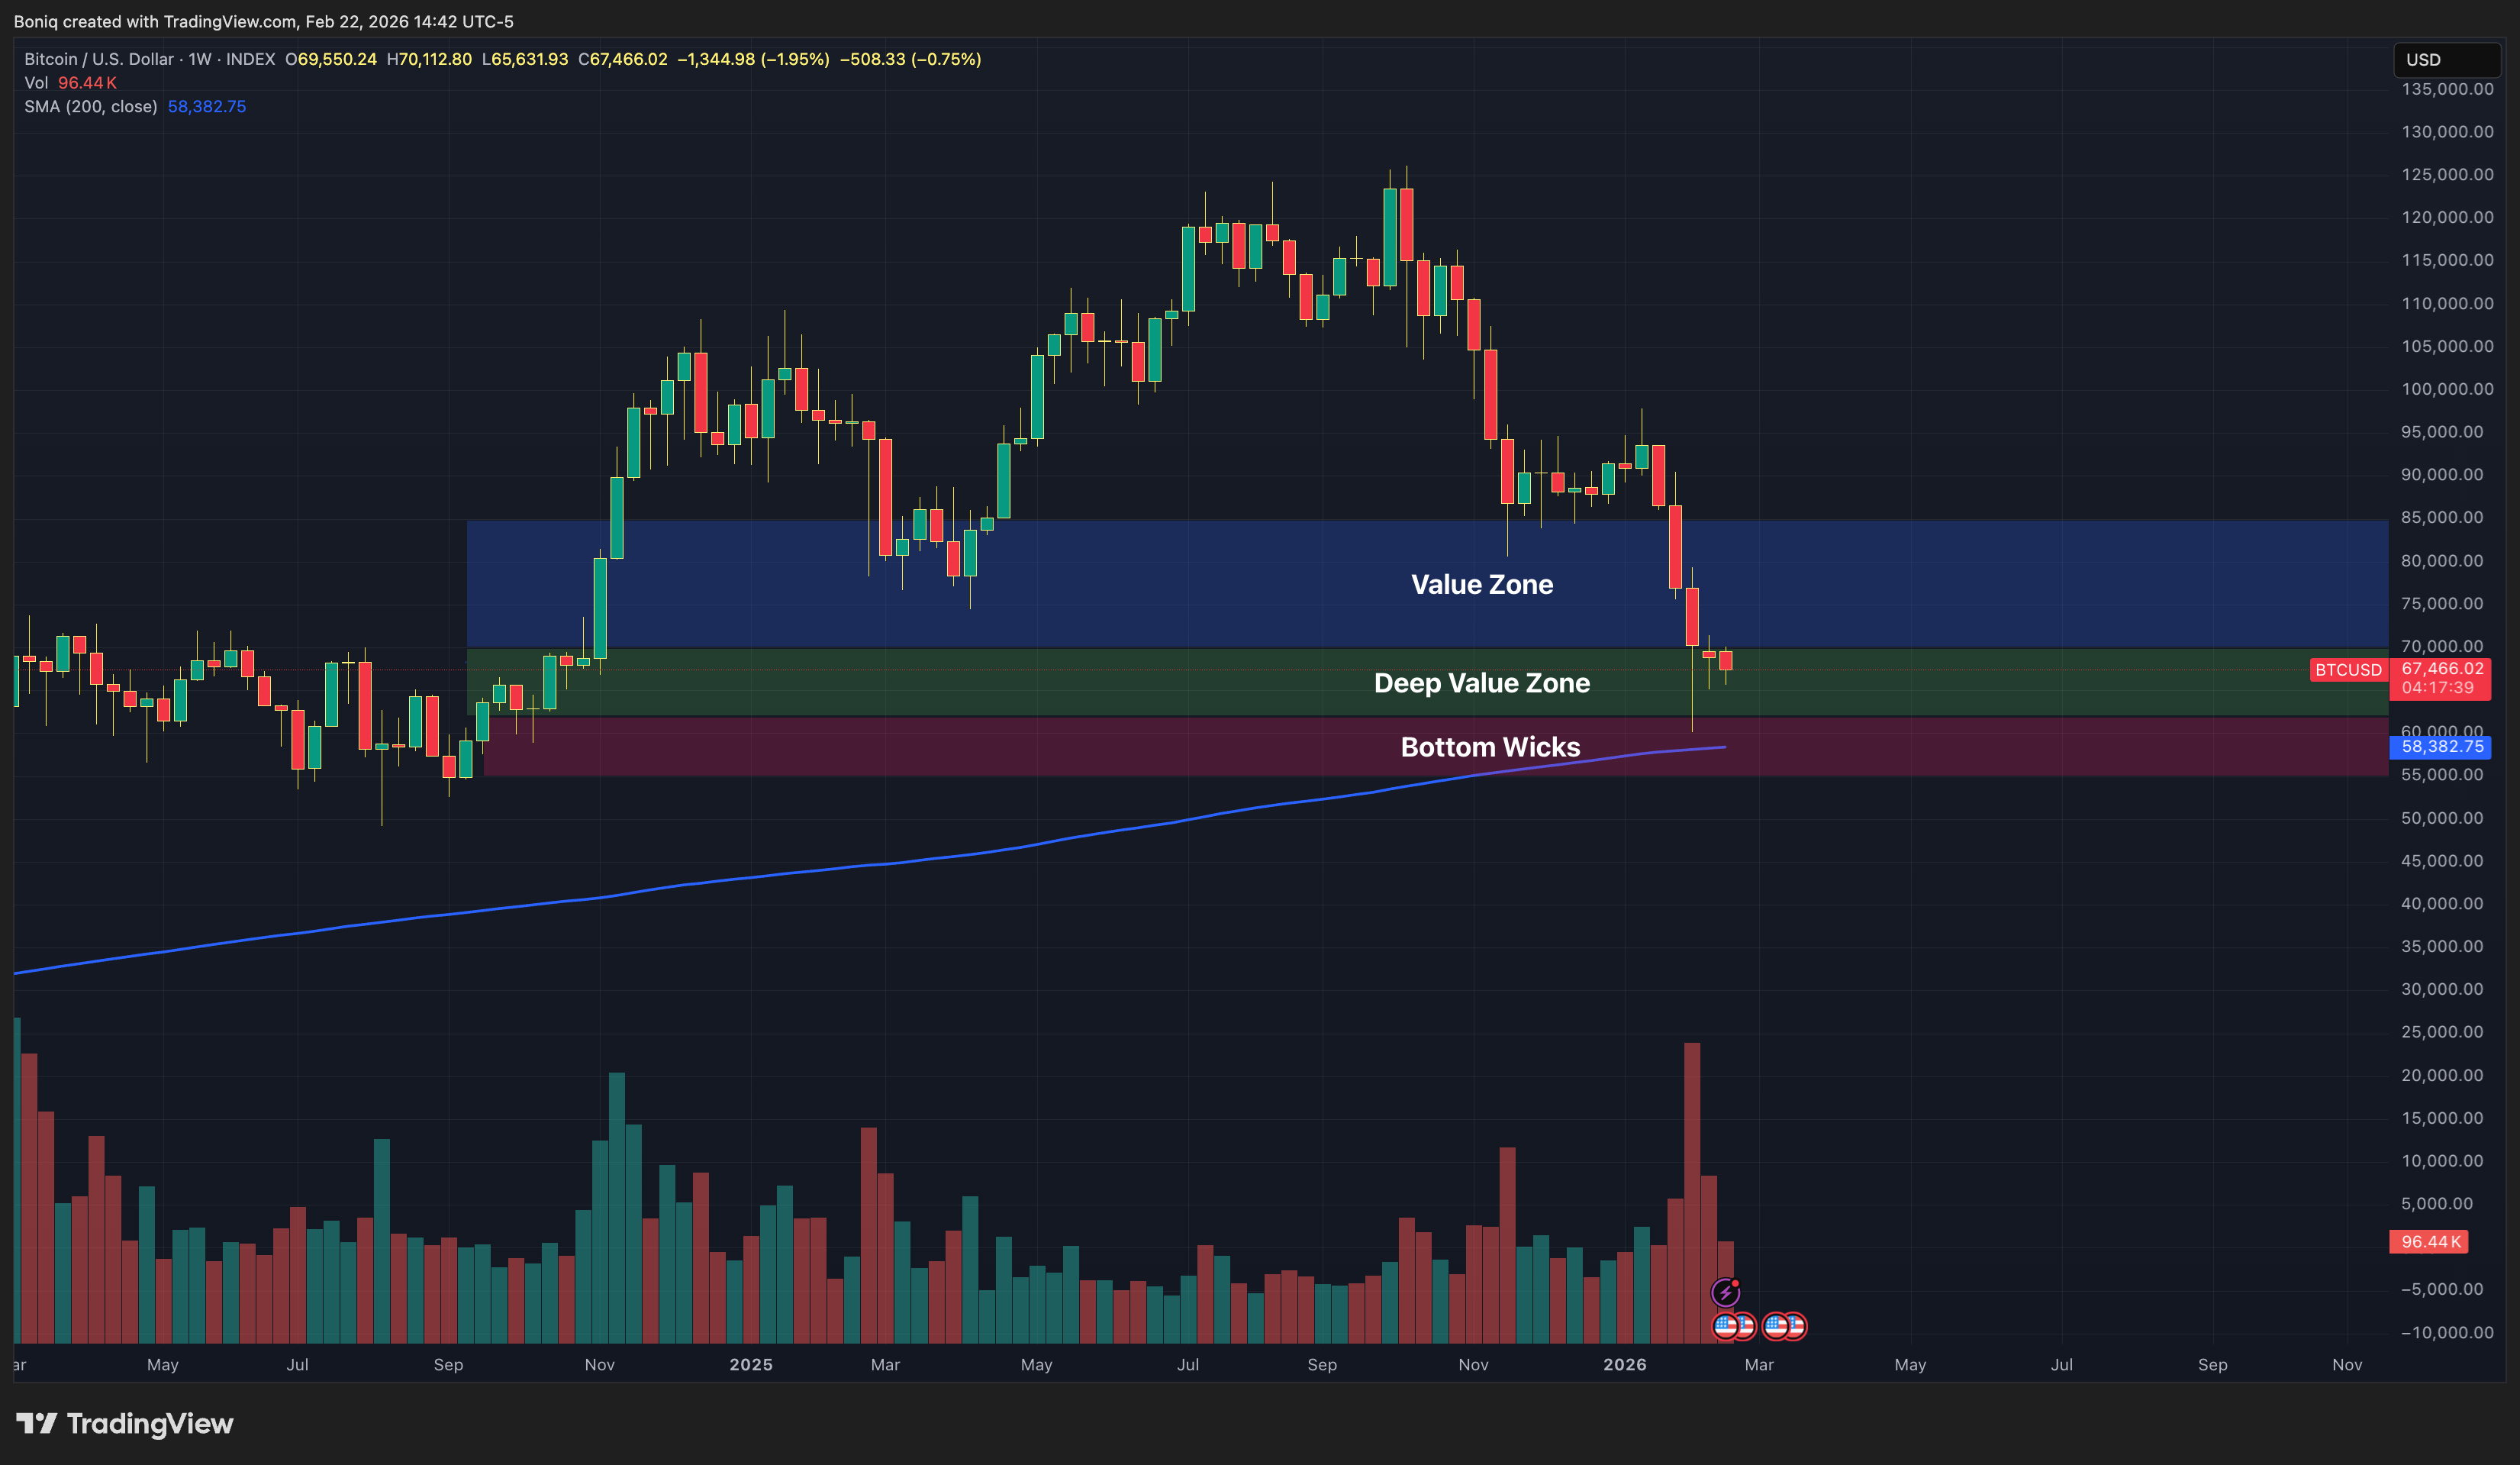
1️⃣ Value Zone: ~$85k to ~$70k
This region represents prior acceptance and heavy trading throughout 2024–2025.
In a bull market, this zone acts as support.
In a bear market, it often becomes resistance.
If price rallies into this region without a liquidity catalyst, expect supply.
2️⃣ Deep Value Zone: ~$70k to ~$62k
This is where long-term investors should become more comfortable accumulating.
It’s statistically more attractive.
It reflects material drawdown.
It sits beneath prior structural acceptance.
If you’re a long-term allocator, this is not where you panic.
This is where you think.
3️⃣ Capitulation Wicks Zone: ~$61k to ~$55k
This is the emotional discount.
Fast moves.
Liquidations.
Forced selling.
We already wicked into this region around $60k.
That move likely qualifies as price capitulation.
But here’s the key:
Capitulation does not guarantee immediate recovery.
It often precedes time pain.
What Time Pain Actually Feels Like
Time pain doesn’t require lower prices.
It requires lower enthusiasm.
It looks like:
Rallies that stall.
Breakouts that fail.
Months of sideways churn.
Bitcoin trending nowhere while other assets move.
It’s checking price daily even though nothing changes.
It’s second-guessing your thesis.
It’s wondering if maybe the cycle really is different this time — just not in the way you hoped.
That’s the danger zone.
Because many investors can survive a crash.
Few survive boredom.
The Visible Range Volume Profile (VRVP) Tells the Same Story
Now let’s add the Visible Range Volume Profile (VRVP) to the chart.
This shows where the most trading volume has occurred since March 2024.
Chart 2: Weekly BTC with Visible Range Volume Profile
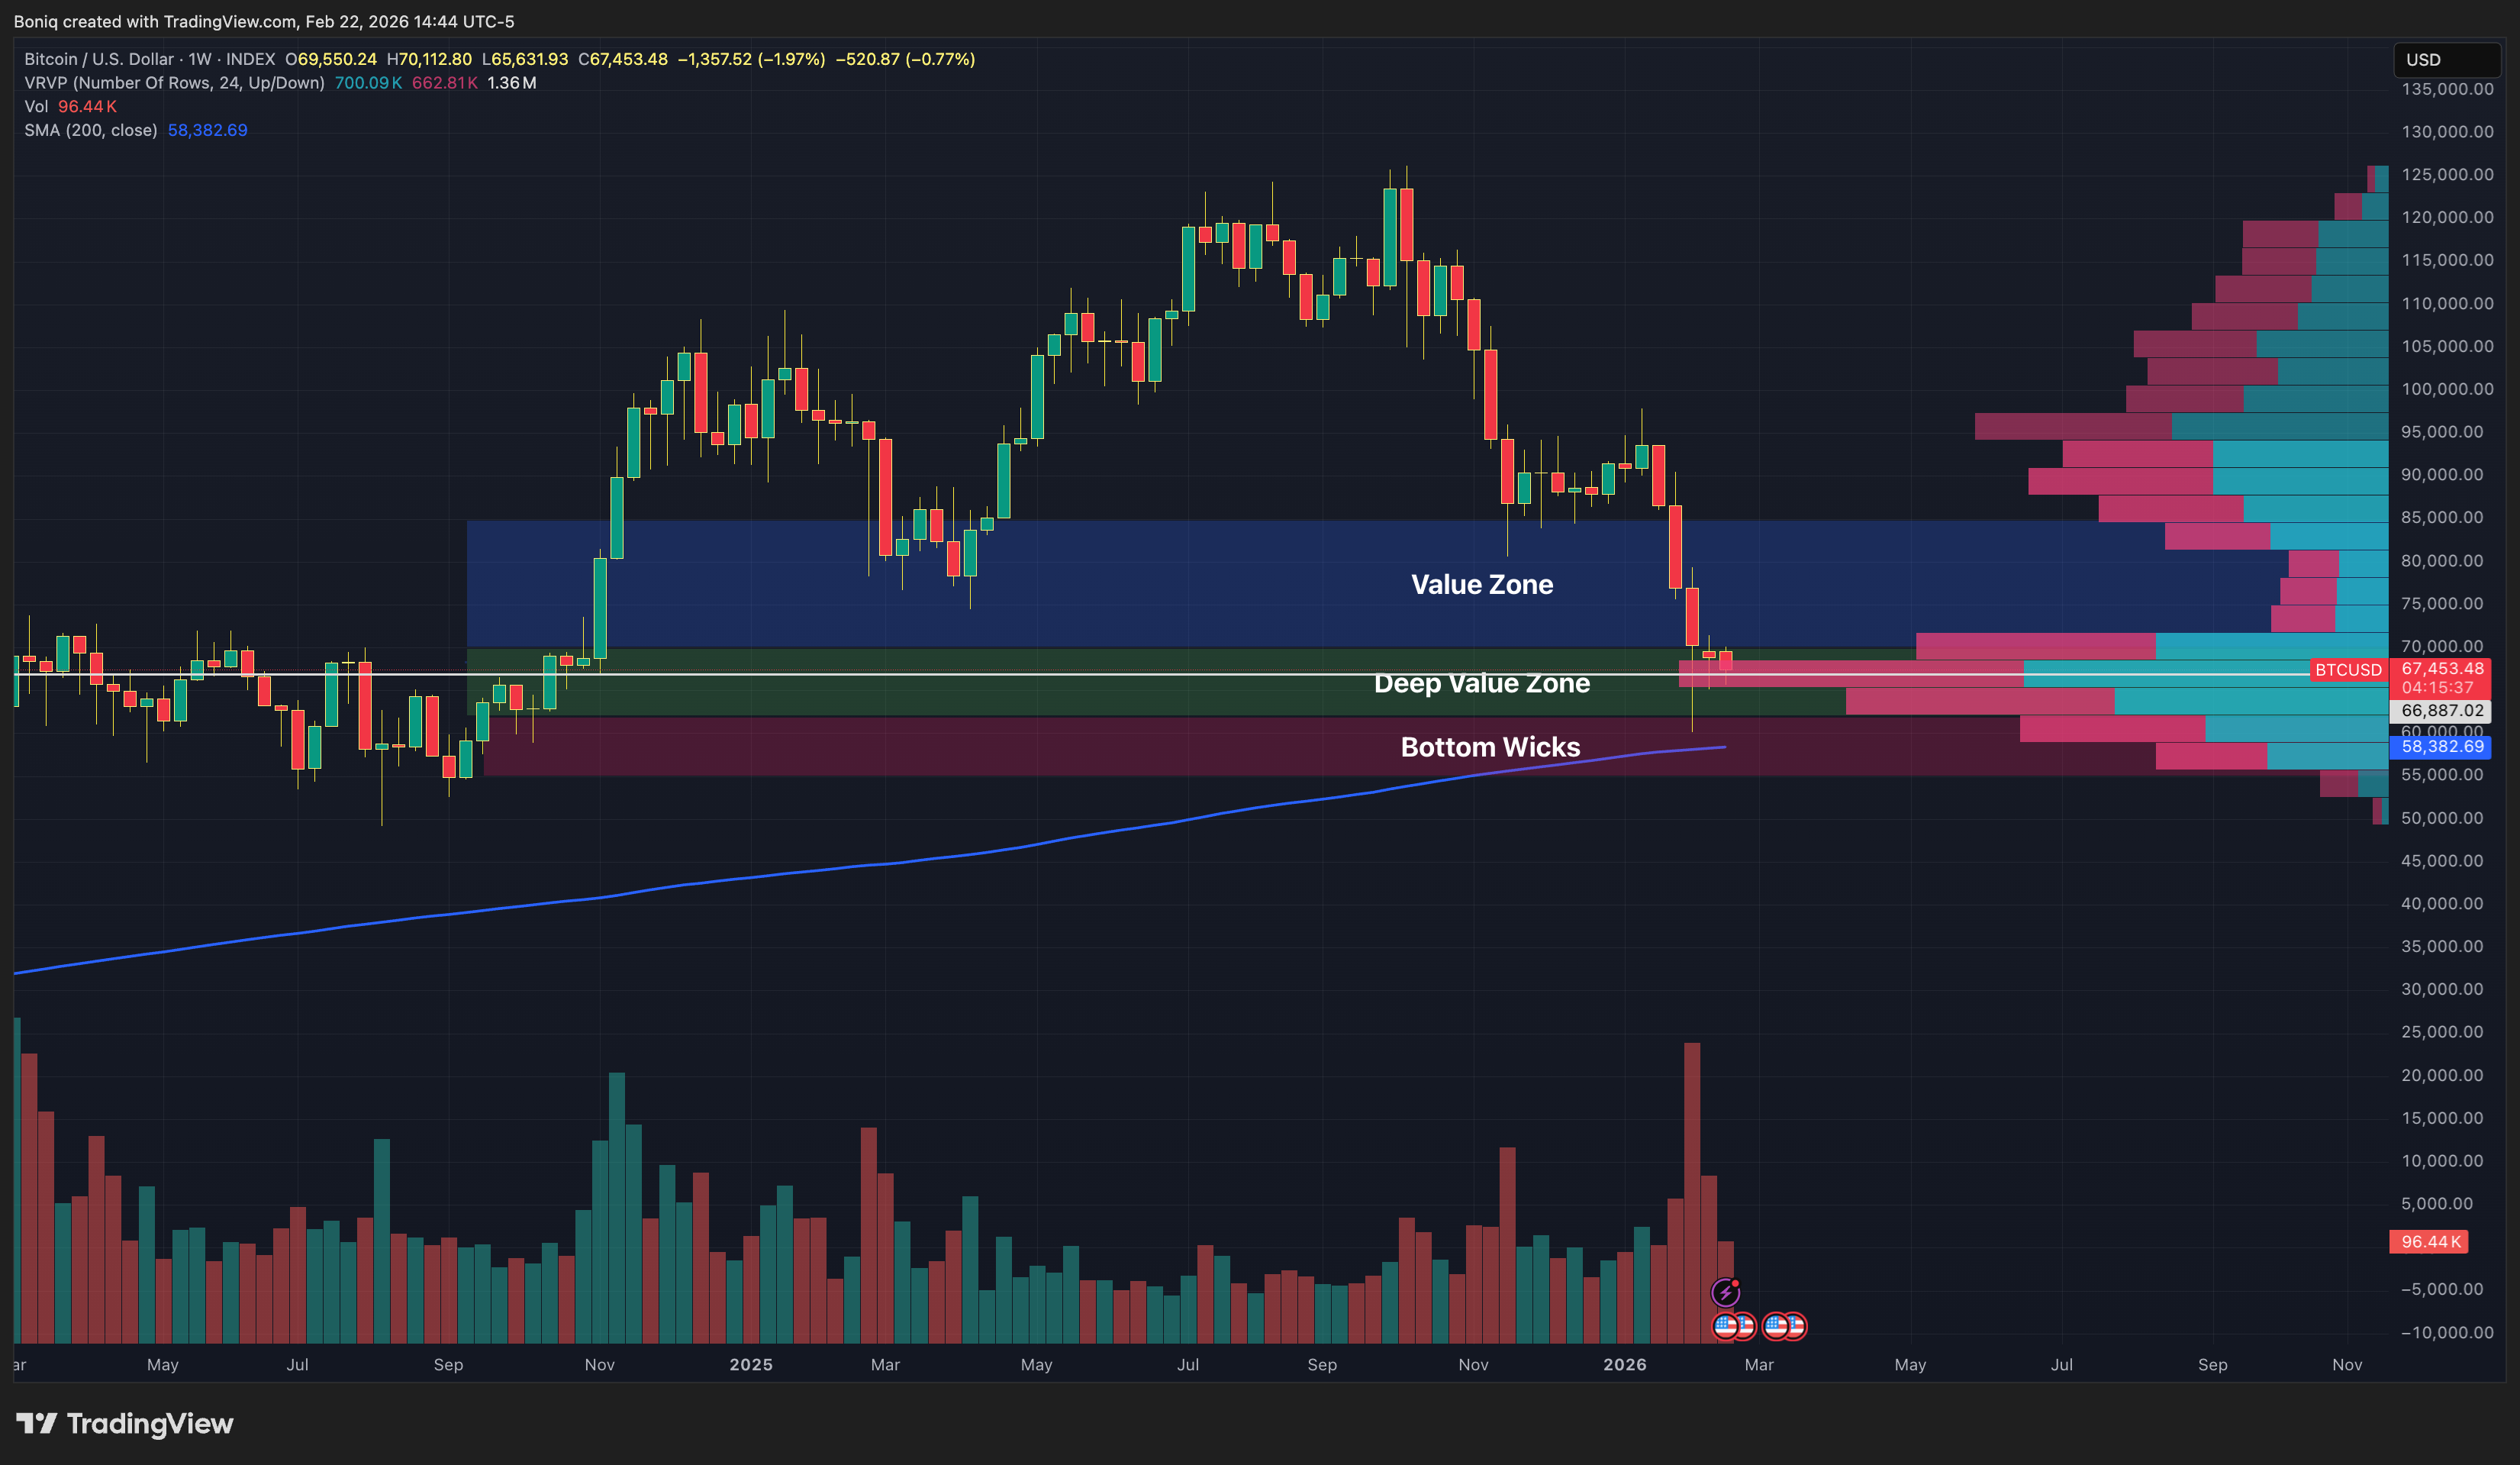
The Point of Control (POC) is at approximately $67k.
That means:
For nearly two years on the weekly chart, this is where the most Bitcoin has changed hands.
And where is price right now?
Right at the POC.
That is not breakout territory.
That is digestion territory.
What Happens From Here?
First Resistance: ~$71.75k
Volume doesn’t thin dramatically until roughly $71.75k.
That likely acts as resistance.
If we clear it, that’s constructive — but not decisive.
Clean Air to ~$81.5k
Above that region, the volume profile shows thinner liquidity until around $81.5k.
If price can break $71.75k, a move toward $81k becomes plausible.
But here’s my view:
Without a new liquidity catalyst, a move toward $80k–$82k likely becomes a sell-the-rip environment.
In that scenario, I would consider trimming exposure — not because I’m bearish long-term, but because bear market rallies are designed to restore hope before testing conviction again.
My Working Range for Bitcoin in 2026
Absent a macro shock, my base case for this Bitcoin bear market is:
$55k to $80k chopsolidation.
$55k = bottom of capitulation wicks zone
~$58k = 200-week moving average (a major long-term support level)
~$70k–$80k = overhead structural resistance
The 200-week moving average, currently near $58k, is historically a level where Bitcoin does not tend to live beneath for extended periods. Wicks below are possible. Sustained breakdowns without systemic crisis are less common.
Without economic or geopolitical shock, I see ~$55k as the likely floor.
With shock? All bets widen.
What Would Change My Mind?
This is not a doom post.
It’s a discipline post.
Here’s what would shift me from “bear market time pain” to “trend recovery”:
Sustained acceptance above ~$80k
Liquidity expansion re-emerging
Rallies that stop immediately getting sold
Until then, the regime is likely:
Sell the rip. Buy deep value. Protect capital. Stay patient.
What I’m Actually Doing
Accumulating in the Value Zone and even more in the Deep Value Zone
Keeping dry powder for wick events
Willing to trim into thin-volume rallies toward ~$80k
Mentally preparing for boredom
Because if this is time pain, prediction is less important than endurance.
Final Thought
The crash was the easy part.
Time pain is where people abandon good strategies.
If Bitcoin is in a 2026 bear market, the goal isn’t to perfectly time the bottom.
It’s to survive the grind correctly.
And if we are sitting at the highest two-year volume node — right at the Point of Control — then digestion, not breakout, is the higher-probability state.
This is not capitulation.
It’s consolidation.
And consolidation tests conviction far more than panic ever does.
What’s harder for you — the crash, or the boredom that follows?