

Fed Liquidity Watch // Issue #11
Three weeks of accumulation pushed the TGA above $1 trillion. This week, it started coming back down — and the mechanics of what happens next are worth understanding.


Issue #10 ended with a loaded question: the TGA had just crossed $1 trillion — the highest balance in this series — and the only thing left to watch was when it would begin to drain.
This week, it started.
The reservoir began to release.
Quick Update — Week of April 29, 2026
Three rows from Table 1, Wednesday column:
Reserve balances with Federal Reserve Banks: $2,919.2B — up $4.6B from last week
U.S. Treasury General Account (TGA): $988.1B — down $19.1B from last week
Reverse repurchase agreements (RRP): $322.7B — down $2.4B from last week
Liquidity Signal — Week of April 29, 2026
Direction: Expanding
Primary Driver: The TGA fell $19.1B this week — its first decline since the April tax surge began. The reservoir started to drain.
Implication: After three consecutive contracting weeks, the direction reversed. The mechanics are working as expected: TGA down, reserves up. But the net reserve increase of $4.6B was smaller than the combined TGA and RRP releases of $21.5B — other Fed balance sheet factors absorbed most of the difference. The shift in direction matters more here than the magnitude.
What Actually Happened
Three weeks ago, the TGA was under $700 billion. By last week, it had climbed to $1.007 trillion — a $310 billion accumulation driven by the April tax season. Reserves fell sharply in those weeks, and the net effect on financial conditions was significant contraction.
This week, the flow reversed.
The TGA declined $19.1 billion, falling from $1.007 trillion to $988.1B. Still just below $1 trillion, but the direction changed. For the first time since the April surge began, the government’s cash balance moved the other way.
The RRP also fell — $2.4 billion — as money market funds continued to reduce their overnight parking at the Fed.
Combined, the TGA and RRP releases created about $21.5 billion in potential new reserves. Actual reserves rose only $4.6B. The difference — roughly $16.9 billion — was absorbed by other changes in the Fed’s balance sheet. The net expansion in the banking system was modest.
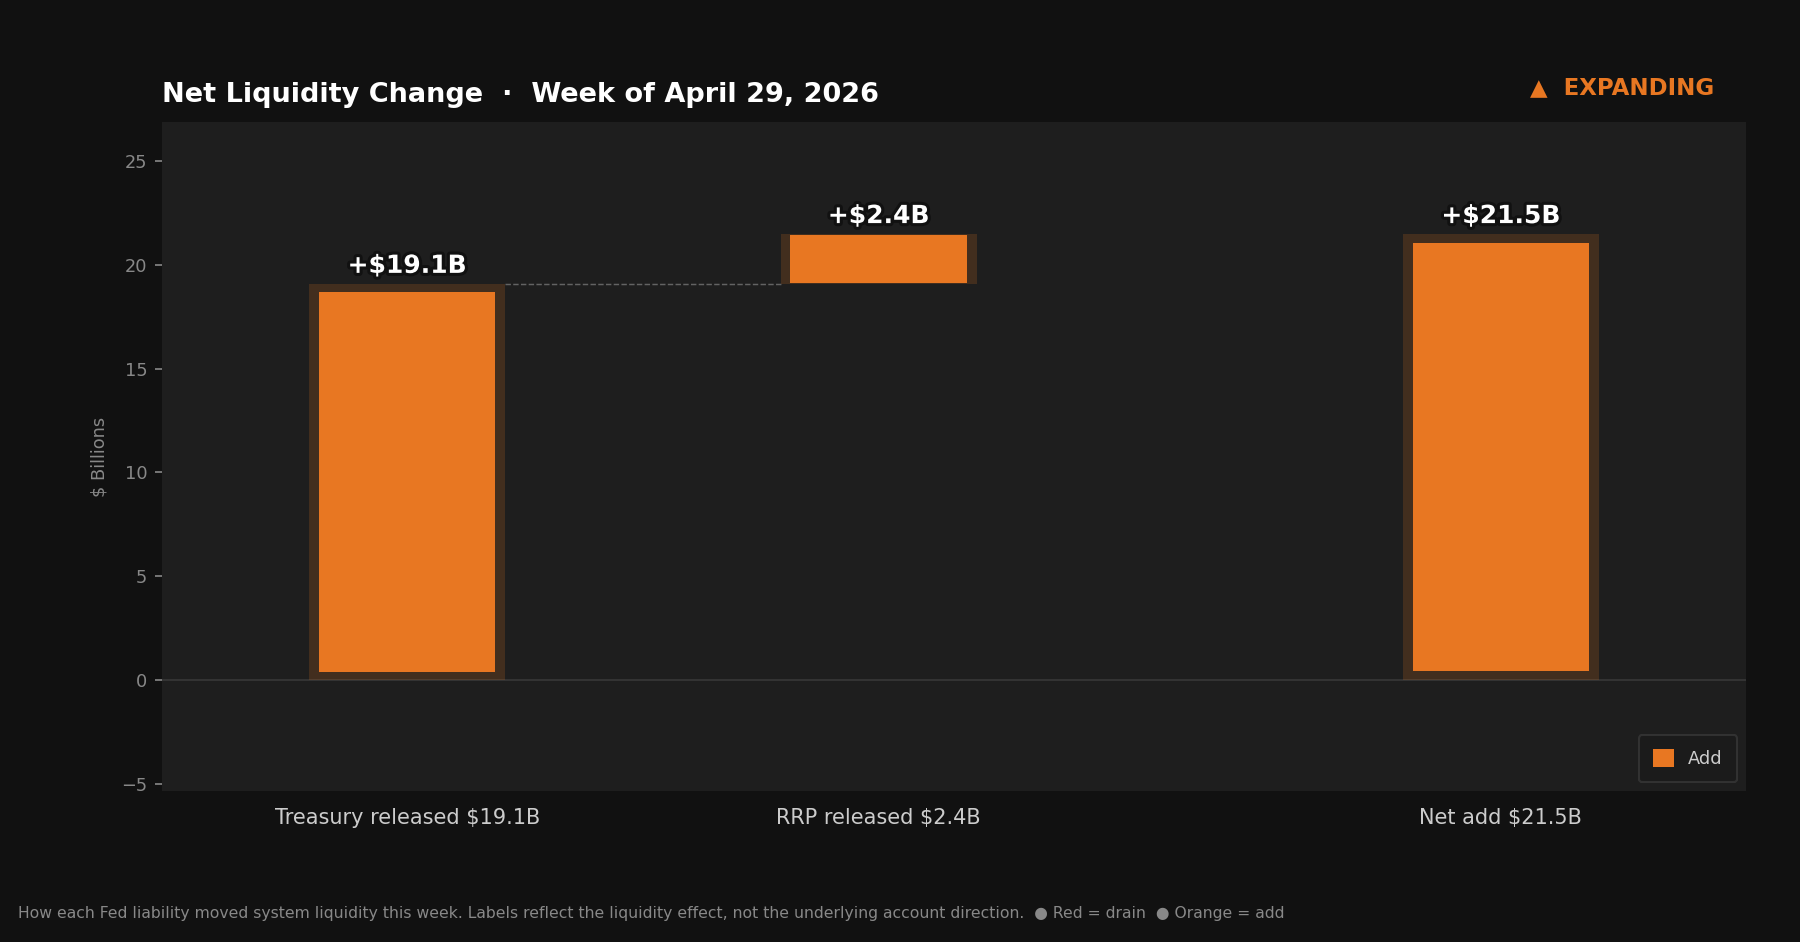
Net liquidity in the financial system, combining Treasury cash balances and reverse repo usage.
The Mechanics, Briefly
For anyone following for the first time:
Reserve balances are what commercial banks hold at the Fed — the banking system’s collective checking account. When reserves rise, banks have more capacity to lend and invest freely. When reserves fall, that capacity tightens.
The TGA is the government’s bank account at the Fed. Tax receipts flow in; spending flows out. It moves inversely to reserves — when the TGA rises, reserves fall; when the TGA falls, reserves rise. They sit at opposite ends of the same seesaw.
The RRP is an overnight facility where money market funds earn a yield by parking cash at the Fed. Money sitting in the RRP is not circulating as reserves.
This week: $19.1 billion out of the TGA. $2.4 billion out of the RRP. $4.6 billion into reserves. The rest absorbed elsewhere in the Fed’s balance sheet.
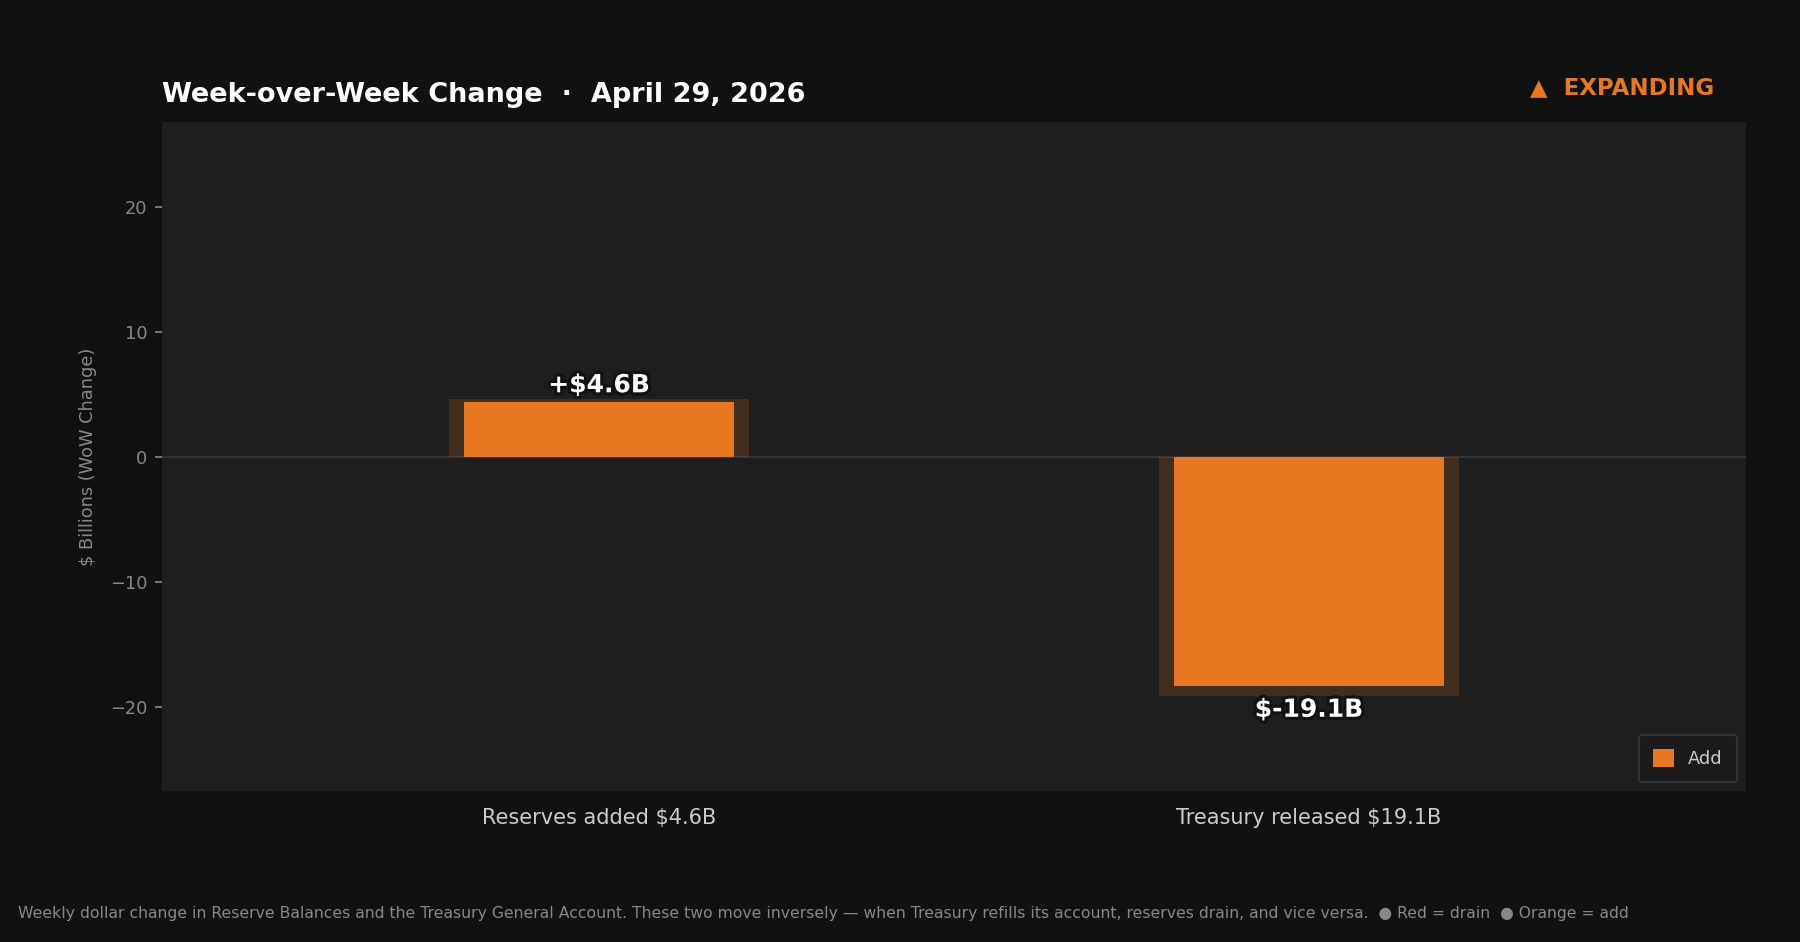
Reserve Balances and the Treasury General Account move inversely — when Treasury refills its account, reserves drain, and vice versa.
The First Step Down
The TGA’s three-week climb from under $700B to $1.007T was one of the most significant liquidity-draining episodes this series has tracked. Hundreds of billions moved out of the banking system in the span of a month. The mechanism was entirely fiscal — tax payments flowing into the government’s account, not any deliberate action by the Fed.
The first step down was modest: $19.1 billion. But first steps are directional signals, not magnitude events. The TGA at $988.1B is still an enormous cash balance — well above where it sat before the April surge — and it will continue declining as Treasury deploys it for normal government operations.
The debt ceiling situation shapes how quickly this happens. When Treasury cannot issue new securities freely, its cash balance becomes its operating fund. Defense appropriations, entitlement payments, interest, and routine government expenses draw it down over time. That process has now begun.
What the past three weeks built up, the coming weeks will release. Not all at once, and not without other moving parts affecting the picture. But the directional shift has started.
What Didn’t Move
The Fed didn’t act. No policy change, no balance sheet adjustment, no statement about conditions.
This is now the third significant liquidity event in this series — two consecutive contracting weeks and the beginning of a reversal — and the Fed has been a passive participant throughout. The forces shaping reserve balances right now are fiscal, not monetary. Tax season built the TGA up. Government spending will bring it back down. The Fed’s own balance sheet is a secondary factor.
There’s a practical reason this distinction matters: when most people think “the Fed is tightening” or “the Fed is easing,” they’re thinking about interest rate decisions or balance sheet programs. But what this series tracks is different — the plumbing that determines how much liquidity the banking system actually has, week to week, regardless of what the Fed does with rates. That plumbing is currently moving on its own schedule.
The Bitcoin Lens
Three weeks of contraction. Then the first week of expansion.
The TGA cycle is, in miniature, a model for what happens with money across longer time horizons. Cash accumulates, sits inert, then gets released into circulation. Every time it moves through the system, it creates conditions — tighter or looser — that ripple through credit markets, asset prices, and economic activity.
The interesting part isn’t any single week. It’s the aggregate. Add up all the accumulations and all the drawdowns over years and decades, and the total supply of dollars in the system has a consistent directional bias: it grows. Tax receipts arrive, get spent, and the spending creates conditions for more spending. Debt refinancing keeps the cycle running. The tools for managing all of this — rate adjustments, balance sheet policy, Treasury issuance composition — are all denominated in the same units they’re trying to manage.
Bitcoin’s supply doesn’t respond to any of this. It was fixed before any of this cycle began and will remain fixed after it ends. The TGA drained $19.1 billion this week and reserves rose $4.6 billion. The cycle continues, as it always does. And the 21 million remains exactly what it was.
The H.4.1 report is released every Thursday by the Federal Reserve. This series tracks the three figures that matter most: reserve balances, the TGA, and reverse repo — and explains what their movements mean for financial conditions.