

Fed Liquidity Watch // Issue #3
Reserves rise, Treasury cash drains, and liquidity quietly expands


Every Thursday at 4:30 PM Eastern, the Federal Reserve quietly releases one of the most important financial documents in the world.
No press conference.
No headlines.
Just a spreadsheet.
The report is called the H.4.1 — the weekly snapshot of the Fed’s balance sheet.
Most people never look at it.
But hidden inside are the plumbing mechanics that influence the liquidity environment for nearly every financial asset on Earth — equities, bonds, real estate, and increasingly, Bitcoin.
Liquidity alone doesn’t determine price.
But markets rarely move far without it.
So once a week, we look.
What Changed This Week
Here are the key mechanics from the latest report.
Reserve balances:
$3.016T (↑ $49.8B)
Treasury General Account (TGA):
$832B (↓ $55.6B)
Reverse Repo Facility (RRP):
$325.7B (↑ $4.4B)
Those three components tell most of the short-term liquidity story.
To understand why, we need to translate what they represent.
Bank Reserves
Reserves are deposits that commercial banks hold at the Federal Reserve.
When reserves rise, the banking system generally has more liquidity available to support financial activity.
When they fall, liquidity tightens.
This week reserves increased nearly $50 billion — a fairly large move for a single week.
But the real question is where that liquidity came from.
Treasury Cash (TGA)
The Treasury General Account is essentially the U.S. government’s checking account at the Federal Reserve.
When the Treasury spends money, funds leave the TGA and flow into the banking system.
When the Treasury collects taxes or issues debt, funds move into the TGA, pulling liquidity out of the system.
This week the TGA fell by about $56 billion, meaning the Treasury injected a significant amount of liquidity back into financial markets.
That Treasury spending was the primary driver of the large increase in reserves.
Reverse Repo Facility
The Reverse Repo Facility allows money market funds to temporarily park cash at the Fed overnight in exchange for Treasury collateral.
When usage declines, that cash typically moves back into financial markets.
When usage increases, liquidity temporarily drains from the system.
This week usage rose slightly by about $4.4 billion.
In the big picture, that move is small.
The more important structural point is that the facility is much smaller than it was during the tightening phase, when over $2 trillion sat parked there.
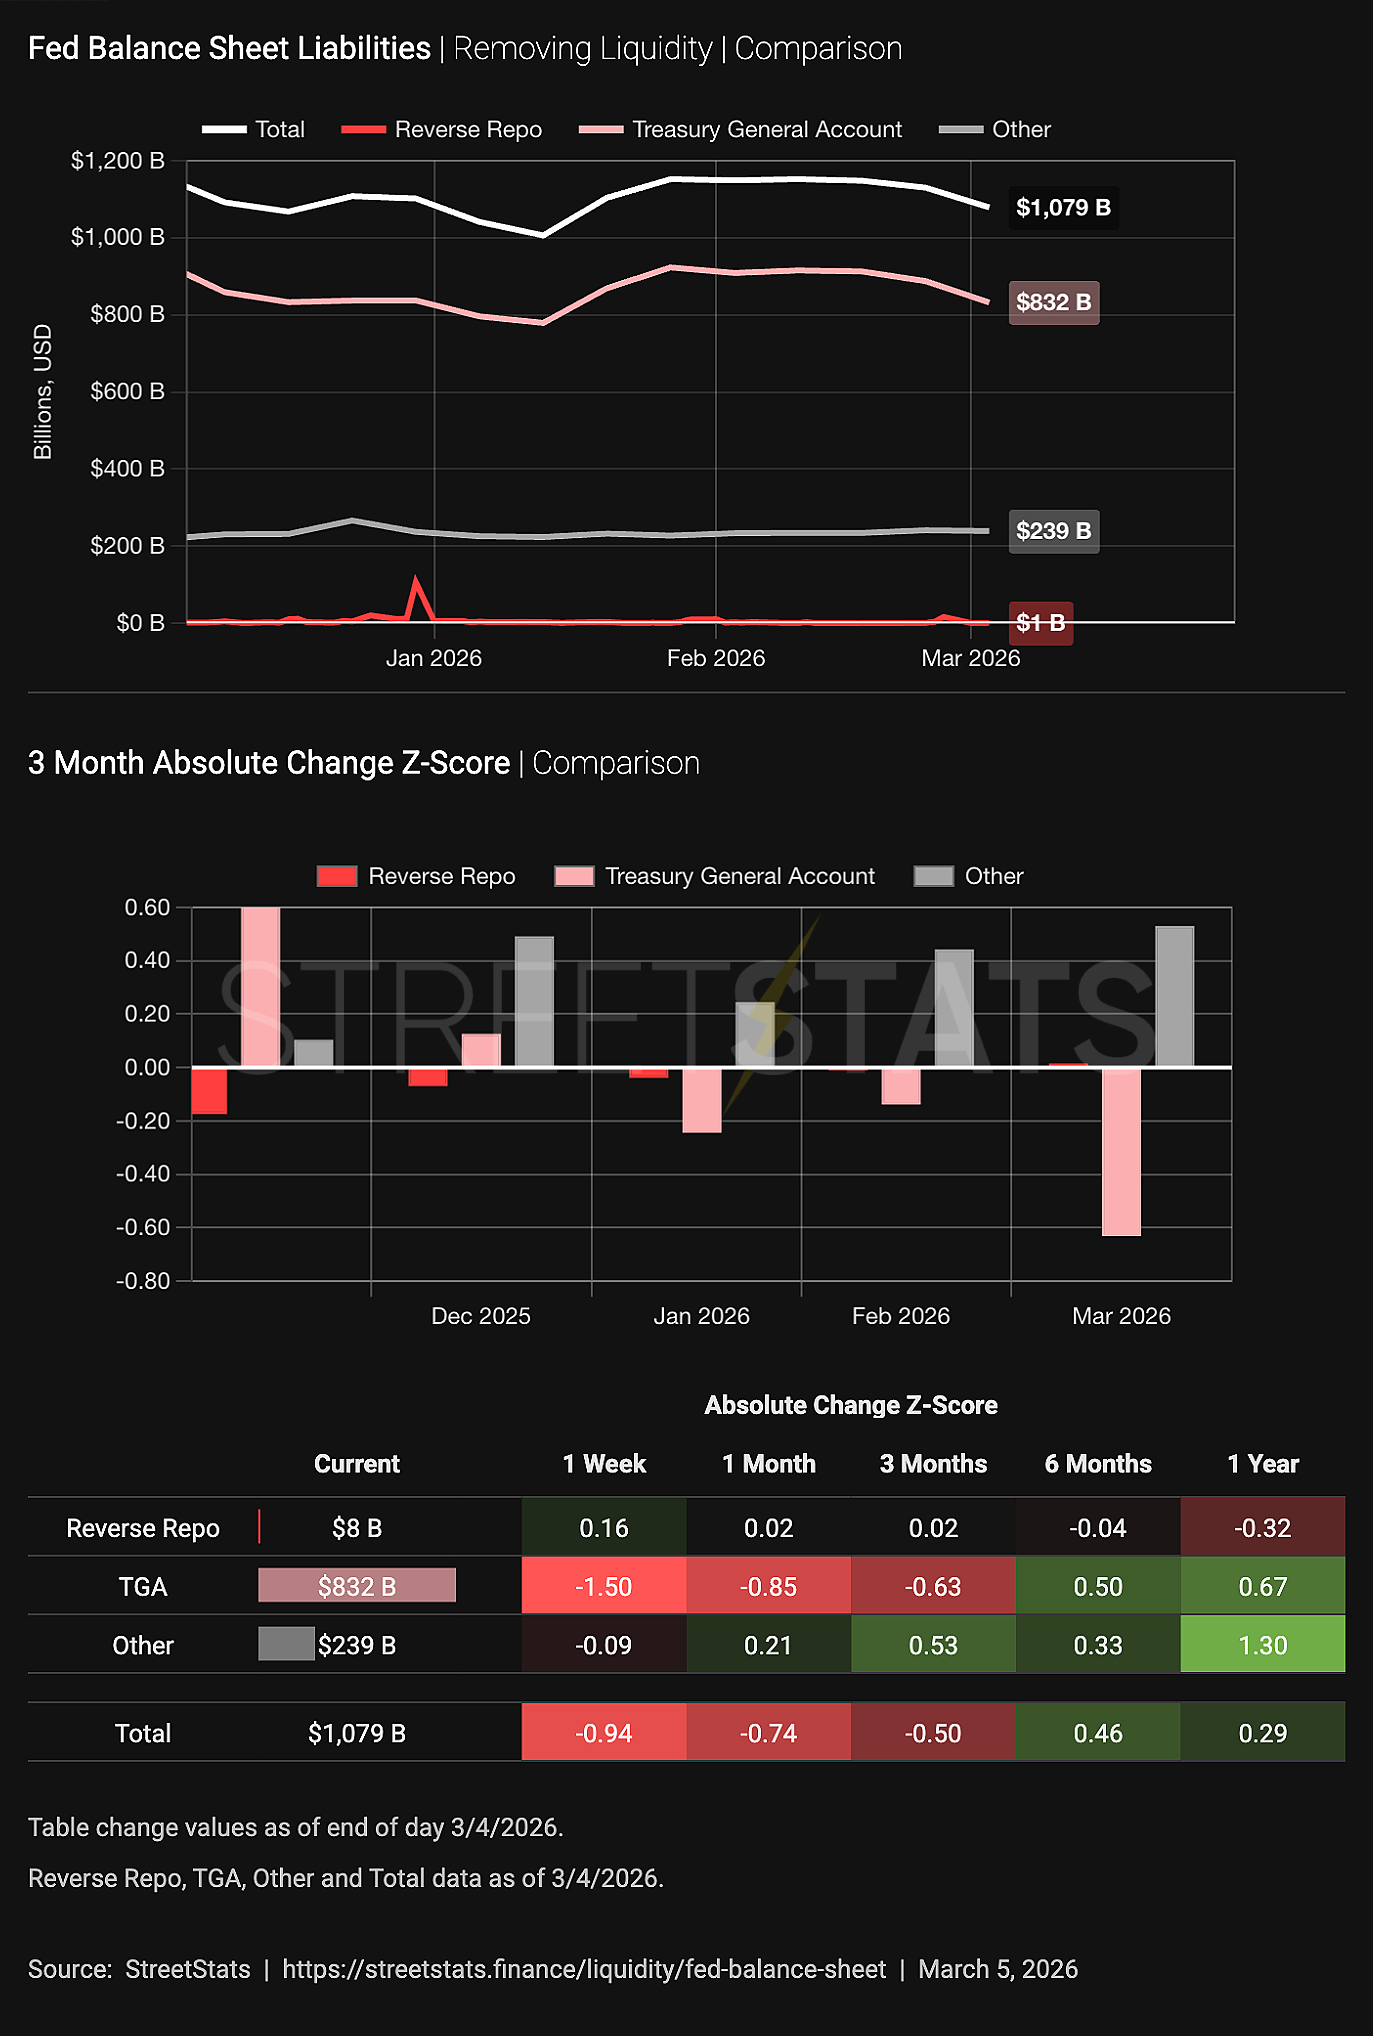
Key liabilities on the Fed’s balance sheet that influence liquidity: Treasury cash (TGA), reverse repo usage, and bank reserves.
Net Effect on Liquidity
Putting the pieces together:
• Treasury spending added liquidity
• Reverse repo usage increased slightly
• Bank reserves rose sharply
The overall result was a noticeable increase in system liquidity this week.
But liquidity rarely shifts in dramatic bursts.
It tends to move slowly through the pipes.
One week of data doesn’t tell the whole story.
What matters is the trend.
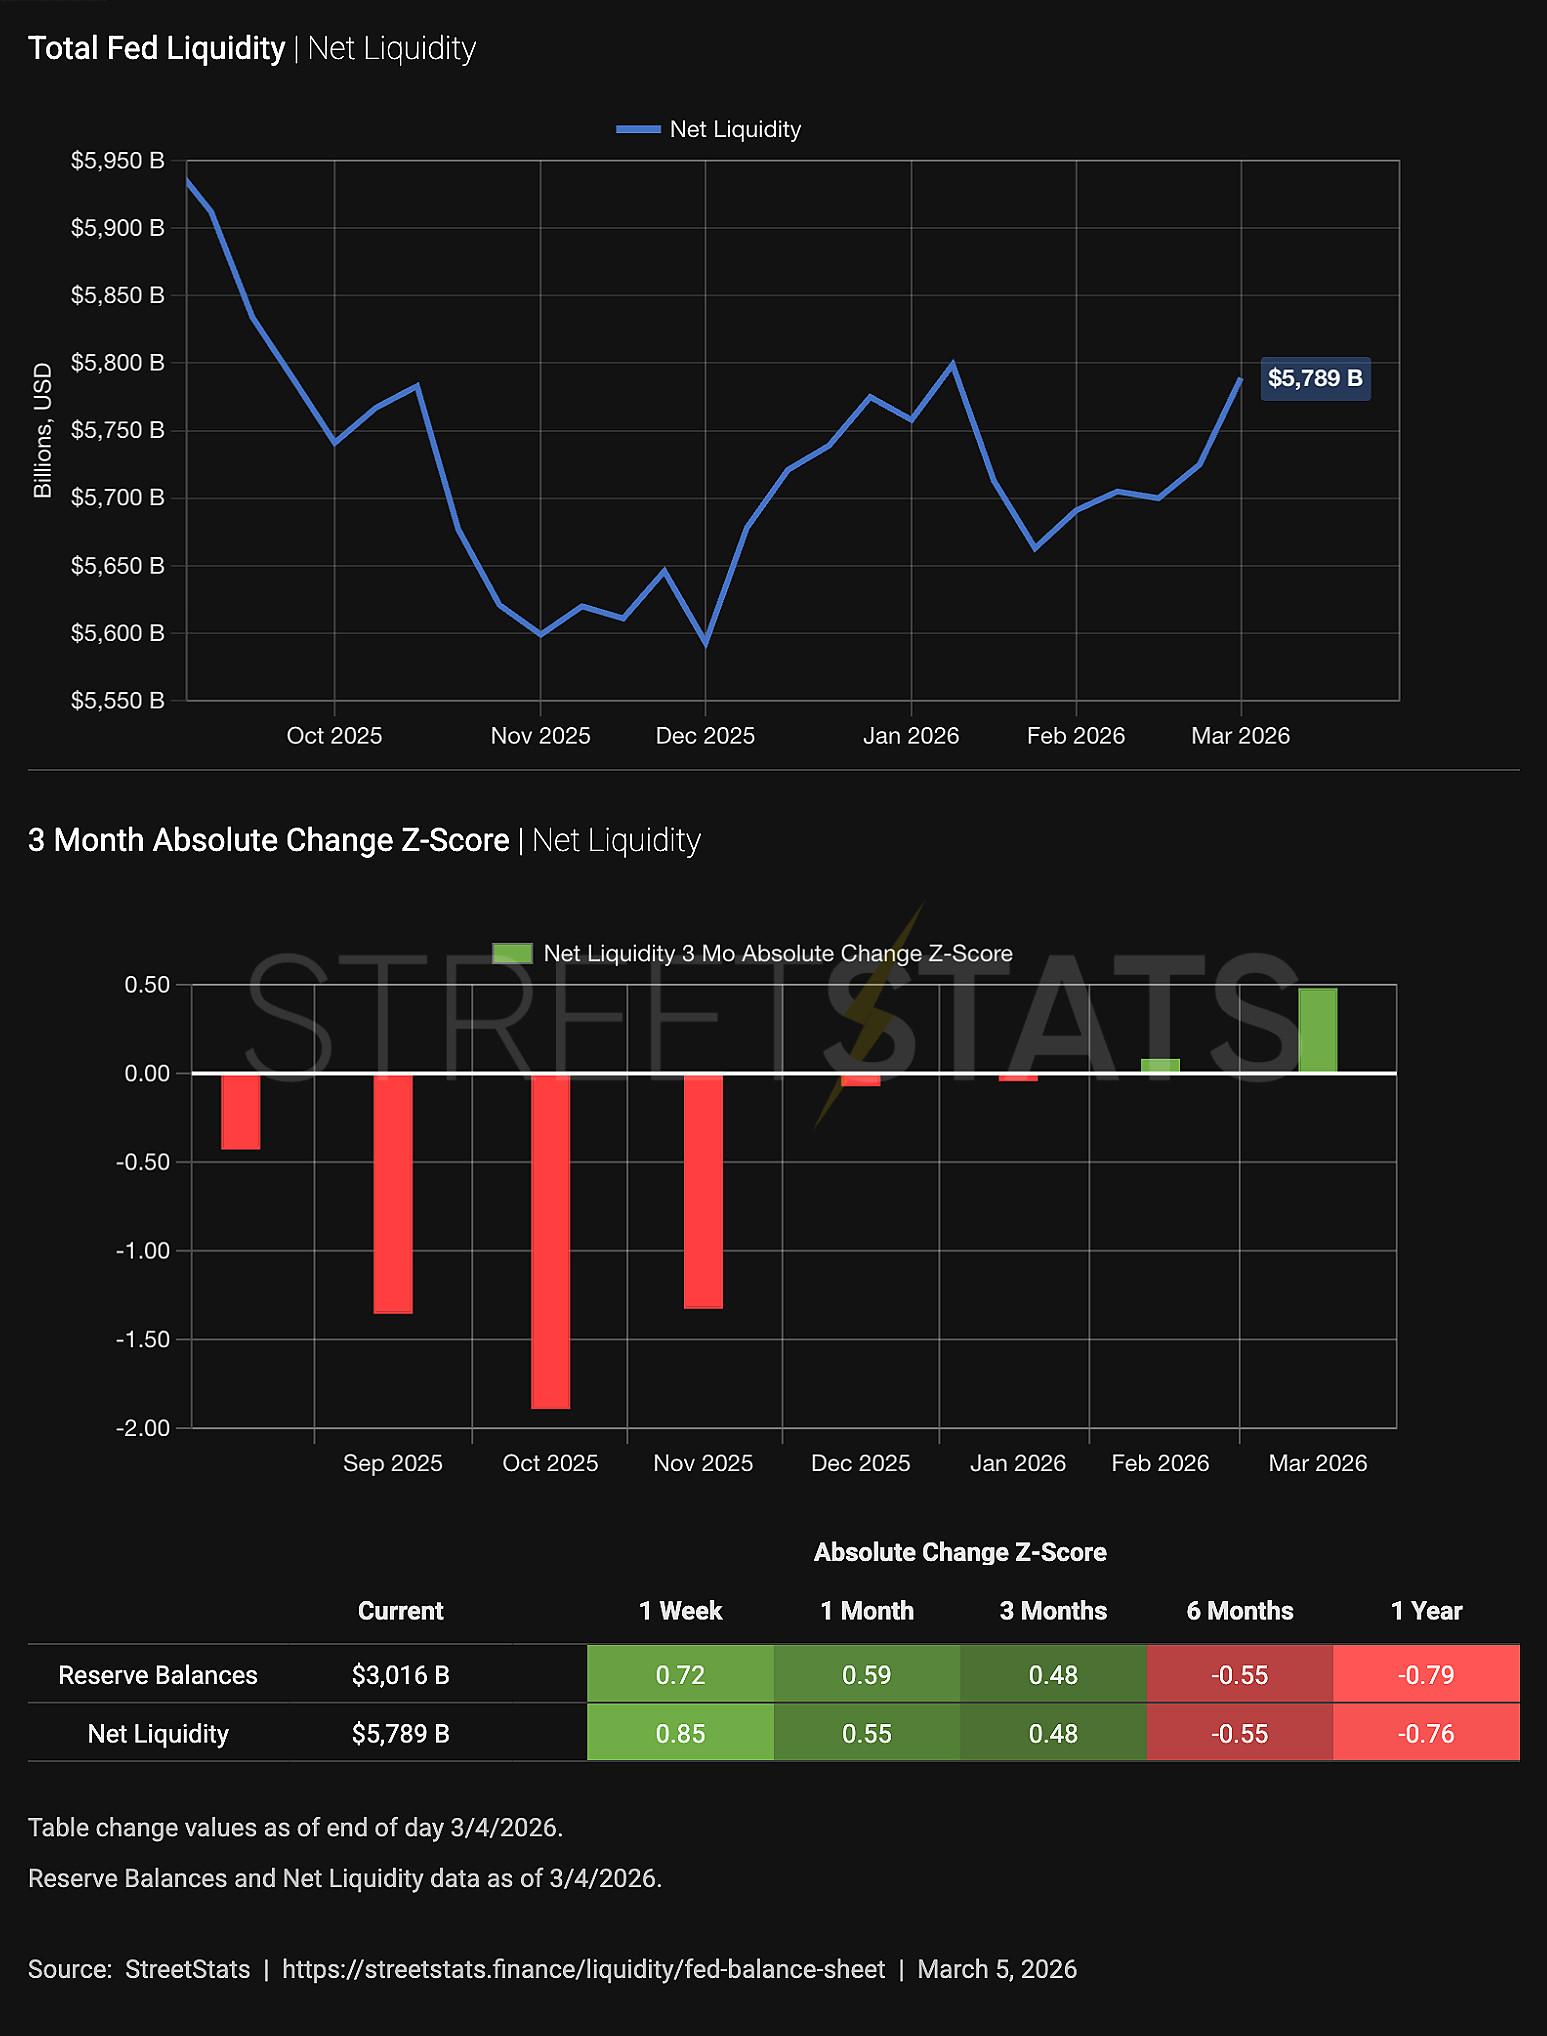
Net Liquidity in the financial system, combining Fed assets, Treasury cash balances, and reverse repo usage.
The Current Liquidity Regime
Several structural observations remain unchanged.
• The Fed is no longer actively shrinking its balance sheet through quantitative tightening
• Mortgage-backed securities continue gradual runoff
• Treasury holdings increased modestly due to reserve management purchases
• The Treasury General Account is the dominant short-term liquidity lever
• Reverse repo usage is structurally much smaller than during the tightening cycle
• Bank reserves remain elevated and stable relative to historical norms
In other words:
The system currently shows no clear signs of stress.
Liquidity conditions are neither rapidly expanding nor sharply contracting.
They are simply moving through the system week by week.
Why This Matters
Liquidity is one of the most misunderstood forces in finance.
It is often described as “money printing.”
But the reality is much more mechanical.
Liquidity is simply the financial system’s ability to fund activity.
Think of it like water pressure in a city.
When pressure rises, water flows easily through every pipe.
When pressure falls, even small demands can cause strain.
Financial markets behave the same way.
Assets don’t just compete on fundamentals.
They also compete for where liquidity flows.
Where Bitcoin Fits
Bitcoin sits in a unique position inside this system.
Unlike stocks, real estate, or bonds, its supply cannot expand.
The number of bitcoin units issued is predictable, shrinking over time, and is ultimately fixed and finite.
Which means something interesting happens when liquidity grows.
New money cannot create more bitcoin.
It can only bid for the existing supply.
This is why I describe Bitcoin as a sponge for liquidity.
The sponge itself doesn’t change.
But over time, more and more liquidity flows into it.
Final Thoughts
One weekly report won’t move markets.
But it helps us understand the environment markets are moving through.
This week’s message was fairly simple:
Treasury spending added liquidity.
Reserves jumped higher.
Financial conditions loosened slightly.
Nothing dramatic.
But over time, those small changes accumulate.
And eventually the water has to flow somewhere.