

H.4.1 Liquidity Watch #13: TGA Drain Continues
Bank Reserves Are Above $3 Trillion — And What 13 Weeks of Data Reveal

The Weekly H.4.1 Breakdown
Issue #13 — May 14, 2026

The dam broke in Issue #12. The TGA shed $125.3 billion in a single week, reserves crossed $3 trillion for the first time in this series, and a loaded spring that spent twelve issues building finally released. The question going into this week was whether that was a one-week event or the opening move of something more sustained.
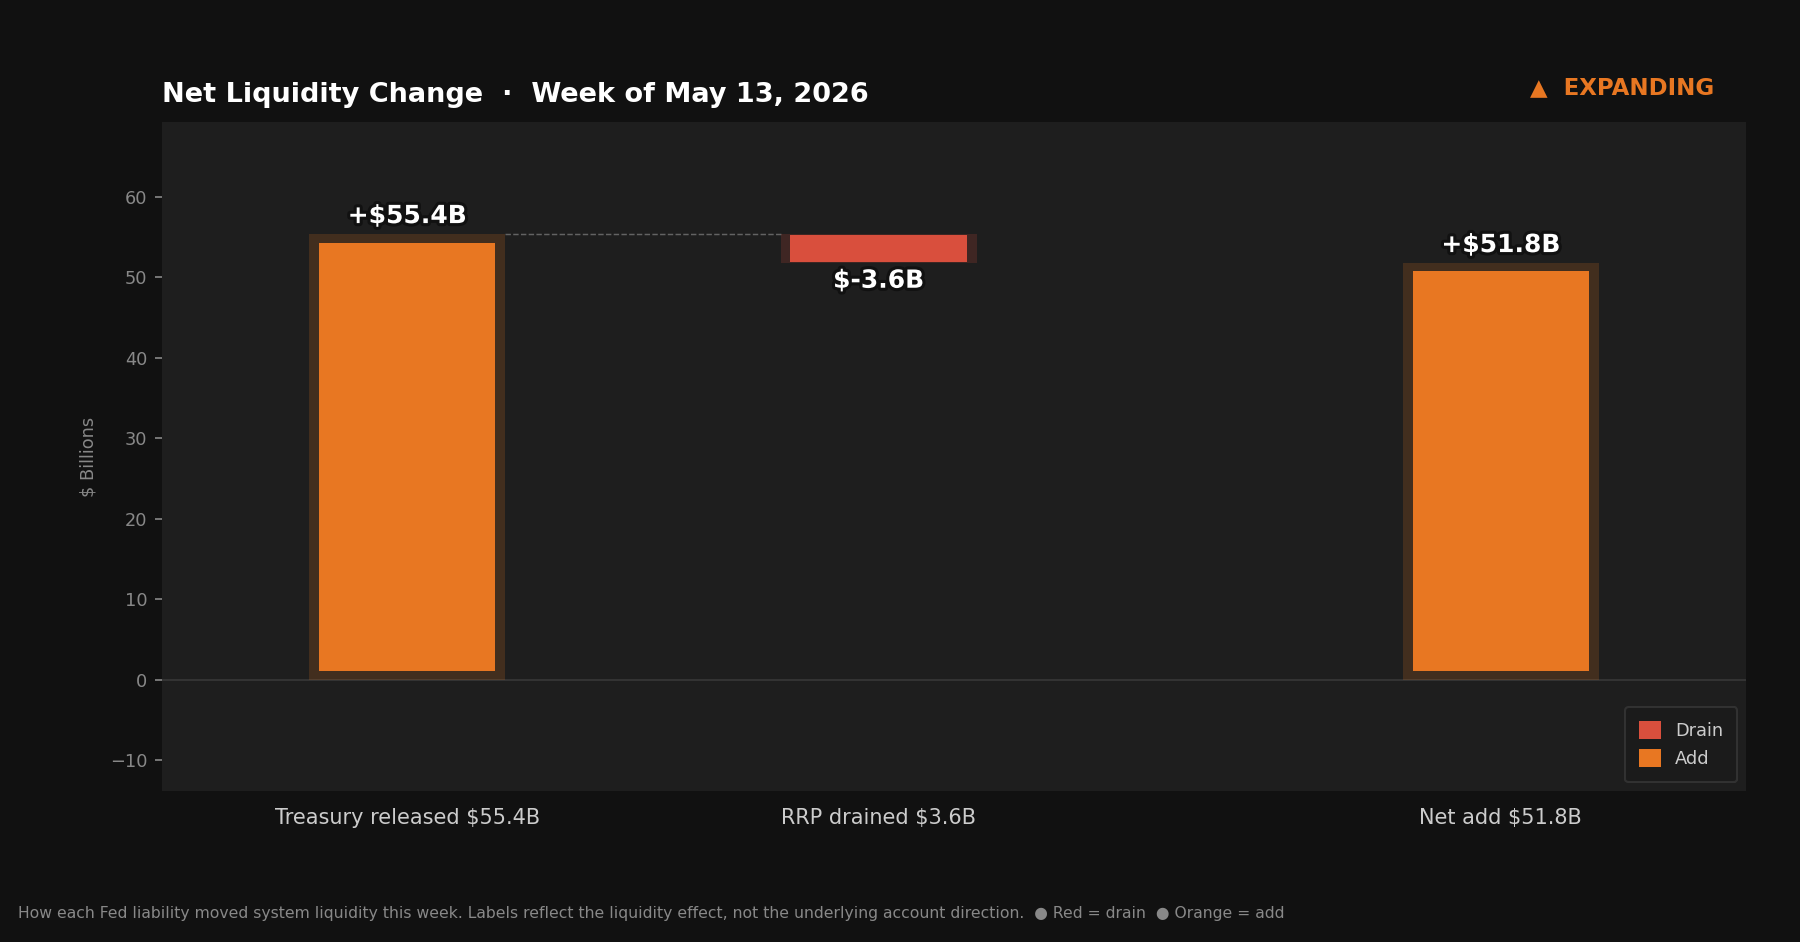
This week’s report has an answer. The drain continued. The TGA dropped another $55.3 billion. Reserves rose another $65.9 billion. For the second consecutive week, the banking system holds more than $3 trillion in reserves.
Quick Update — Week ending May 13, 2026
Three rows from Table 1, Wednesday column:
Reserve balances with Federal Reserve Banks: $3,117.4B — up $65.9B from last week
U.S. Treasury General Account (TGA): $807.4B — down $55.3B from last week
Reverse repurchase agreements (RRP): $326.3B — up $3.7B from last week
Liquidity Signal — Week ending May 13, 2026
Direction: Expanding
Primary Driver: TGA drawdown continues — Treasury spent another $55.3B into the system
Implication: Reserves above $3T for a second consecutive week; fiscal spending has now injected nearly $200B since the April peak
What Actually Happened
The week-ending number is $807.4 billion.
That’s how much cash the U.S. Treasury is currently holding in its account at the Federal Reserve — down $55.3 billion from last week’s $862.8 billion, and down $199.8 billion from the April peak of $1.007 trillion.
The mechanics haven’t changed: when Treasury spends, cash moves from its account into the banking system. Every dollar that left the TGA this week landed somewhere as reserves. Reserves rose $65.9 billion, closing Wednesday at $3,117.4 billion — the second consecutive week above $3 trillion.
The RRP edged up $3.7 billion to $326.3 billion. That’s noise, not signal. The TGA was the story again.
What’s notable this week isn’t any single number — it’s the pattern. Three consecutive weeks of TGA drawdown: $19.1 billion in Issue #11 (the first step), $125.3 billion in Issue #12 (the dam breaking), and now $55.3 billion. The reservoir that filled during April tax season is draining steadily.
Whether it continues at this pace, accelerates, or pauses depends on the Treasury’s spending schedule and debt ceiling dynamics. Not on anything the Fed decides.
Net liquidity in the financial system, combining Treasury cash balances and reverse repo usage.
The Mechanics, Briefly
For anyone joining for the first time:
Reserve balances are what commercial banks hold at the Fed — the banking system’s collective checking account. When reserves rise, banks have more room to lend and invest. When reserves fall, that capacity tightens.
The TGA is the federal government’s checking account at the Fed. Tax receipts flow in; spending flows out. When Treasury spends, money leaves its account and lands as reserves in the banking system. The two accounts sit at opposite ends of the same seesaw — one goes down, the other goes up.
The RRP is an overnight facility where money market funds park cash at the Fed. Dollars sitting there are not in circulation.
This week: $55.3 billion drained from the TGA. Reserves rose $65.9 billion. The RRP uptick of $3.7 billion absorbed a small fraction of that flow, but the fiscal channel — Treasury spending — remained the dominant force for the third consecutive week.
Reserve Balances and the Treasury General Account move inversely — when Treasury refills its account, reserves drain, and vice versa.
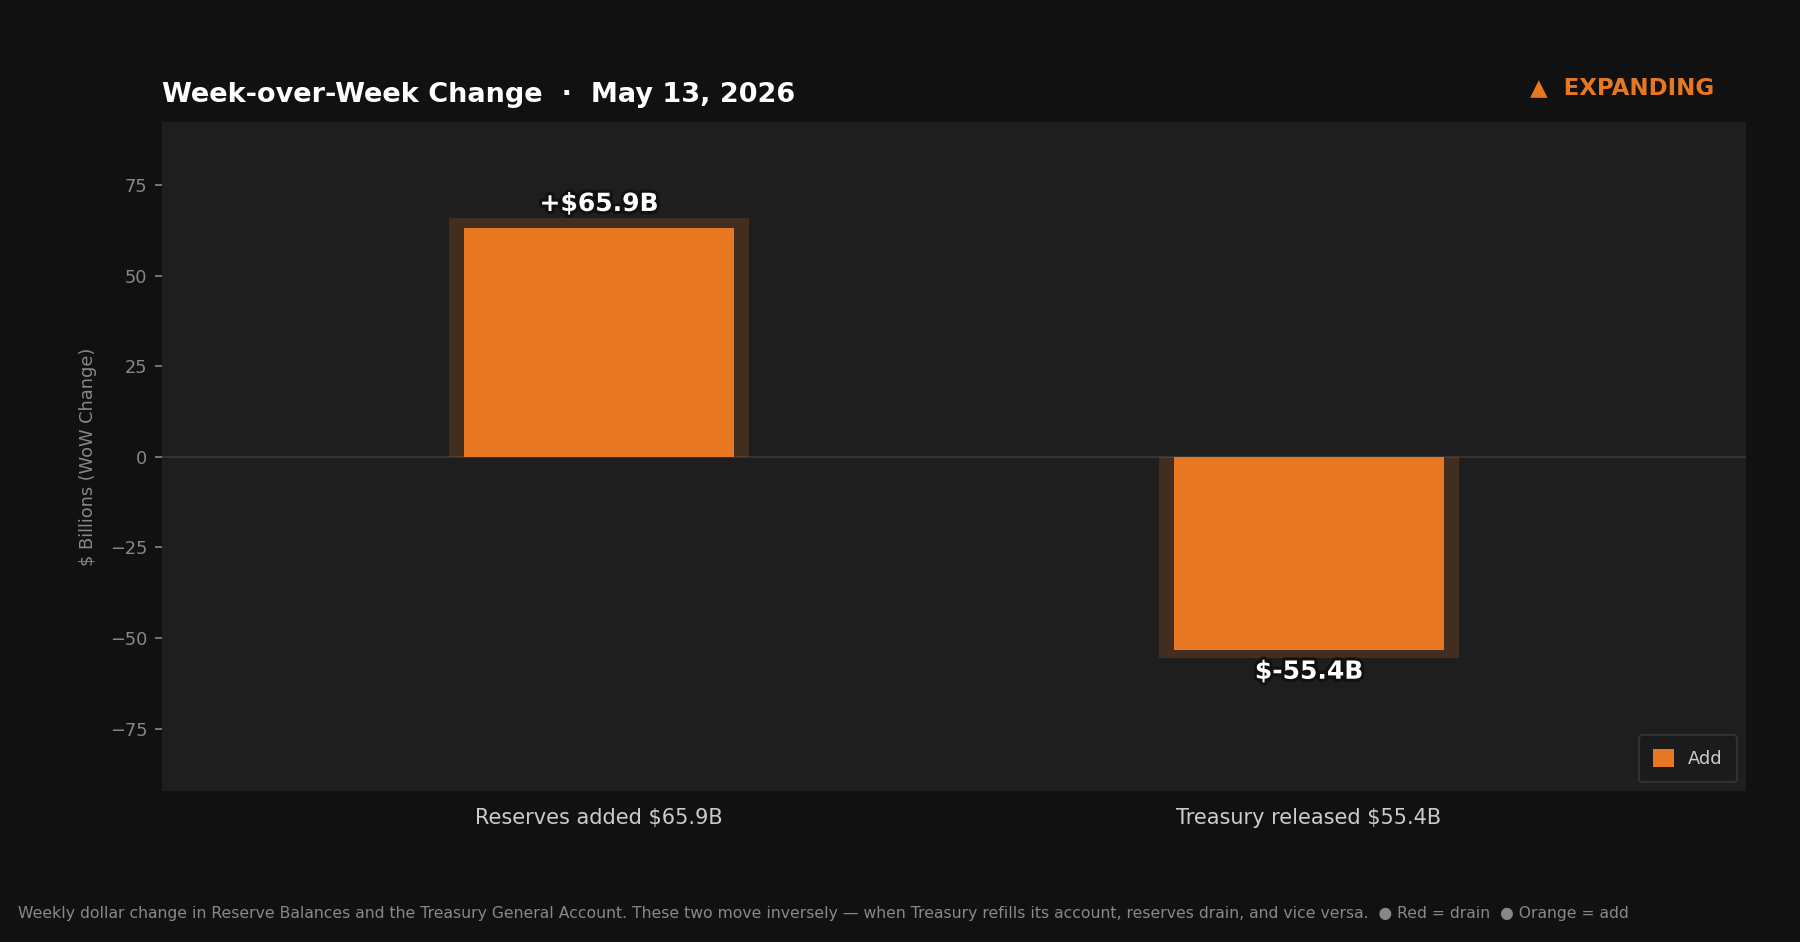
Reserve Balances and the Treasury General Account move inversely — when Treasury refills its account, reserves drain, and vice versa.
The Drain Continues
Three weeks ago, the TGA peaked at $1.007 trillion. Here’s the path since:
Issue #10: $1,007.2B — the peak
Issue #11: $988.1B — first drawdown, $19.1B released
Issue #12: $862.8B — the dam breaks, $125.3B released
Issue #13: $807.4B — drain continues, $55.3B released
Total since peak: $199.8 billion returned to the banking system in three weeks.
The TGA is still well above where this series started — when Issue #1 ran, it sat well below $400 billion. The April tax surge pushed it more than $600 billion higher. The drawdown that began in Issue #11 has now unwound roughly a third of that. The remaining $400-plus billion above historical norms represents future liquidity waiting to enter the system whenever Treasury spends it out.
The pace matters. The $125.3 billion single-week drain in Issue #12 appears to have been the outlier. This week’s $55.3 billion is more consistent with how this kind of drawdown normally runs — steady, incremental, driven by the ordinary rhythm of government spending.
What Didn’t Move
The Fed remained passive this week.
This continues to be the defining context for this series: the most significant movements in reserve balances are happening entirely on the fiscal side. The Fed is watching the same data the rest of us are watching — but the plumbing doesn’t wait for a press conference.
The Bitcoin Lens
Nearly $200 billion returned to the banking system in three weeks. Not because a committee voted on it. Not because a press conference signaled it. Because the Treasury spent money — routine government outlays flowing through a plumbing system that most people don’t know exists.
The total movement across twelve weeks is starker: the TGA swung more than $600 billion in both directions. Reserves moved from well below $3 trillion to above it. Billions in liquidity entered and exited the system on a schedule set by tax deadlines and spending cycles.
Through all of it, the Bitcoin supply curve didn’t move. Every dollar the fiscal system creates, spends, or recycles through these pipes makes a fixed ceiling of 21 million a little harder to dismiss.
That’s what the retrospective in Part 2 is really about.
Part 2: Twelve Weeks of Plumbing
A look back at what the series actually showed — and what it means.
This series set out to track three numbers most financial commentary ignores.
Reserve balances at the Federal Reserve. The Treasury General Account. Overnight reverse repurchase agreements.
Not because they’re glamorous. Not because they show up on CNBC. But because they’re the actual plumbing — the pipes that liquidity moves through before it surfaces in asset prices, credit conditions, and the cost of borrowing. Understanding these three numbers gives you a view of the monetary system that most people don’t know exists.
Thirteen issues in, the data has told a story worth naming.
Issues #1–6: The Baseline
When I started this series, the TGA was well below $400 billion — a relatively normal operating level for the Treasury’s account. The Fed’s reverse repo facility was still drawing down from its historic peak: over $2 trillion at its height, draining steadily as money market funds found better returns elsewhere than parking cash at the Fed overnight. Reserves moved week to week, but without drama.
What stood out most in the early issues wasn’t what moved. It was what didn’t.
The Fed was passive. No major balance sheet adjustments, no policy surprises. Rate decisions made headlines, but the underlying liquidity mechanics were running on their own schedule driven by routine Treasury operations. The first six issues documented that schedule: a system humming along, the TGA moving in its normal range, reserves absorbing the weekly variation.
The RRP kept declining. Quietly, consistently, every week. Capital was leaving the Fed’s overnight facility and finding its way back into the system.
Issues #7–10: Tax Season Arrived
April changed the picture.
Issue #8 flagged what was coming: April tax receipts typically arrive in the second and third weeks of the month, and when they do, the TGA rebuilds. The question was magnitude.
Issue #9 answered it.
The TGA rose $227.3 billion in a single week. That wasn’t a normal swing — the largest single-week TGA increase previously tracked in this series was $33.9 billion. This was nearly seven times that. April tax payments (corporations, individuals, trusts) flowed out of bank accounts and into the Treasury’s account at the Fed. Every dollar that moved drained a corresponding dollar from reserves.
Reserves fell $203.3 billion in the same week.
That was the single-week TGA surge record. Issue #10 then showed the Treasury wasn’t done: another $82.8 billion the following week pushed the TGA above $1 trillion — $1.007 trillion — for the first time in this series.
To put that in perspective: the TGA was well below $400 billion in the first issue. In two weeks it had added over $310 billion and crossed a threshold many market participants don’t even know exists. Reserves, meanwhile, had fallen from their pre-tax-season levels to around $2.4 Trillion — a meaningful tightening in available banking-system liquidity.
The Fed held its meeting, deliberated, and held rates steady. Not one dollar of the liquidity contraction came from a Fed decision. It came from the calendar.
Issues #11–12: The Loaded Spring Releases
Issue #10 called the $1.007T TGA “a loaded spring.” The logic was simple: every dollar in that account represented future liquidity waiting to enter the banking system when Treasury spent it out.
Issue #11 showed the first step of the release — a $19.1 billion TGA drawdown. Modest but directional. The reservoir had started to drain.
Issue #12 showed the drain open fully.
The TGA shed $125.3 billion in a single week, its largest single-week decline to date. That dwarfed the prior records in both directions. Reserves surged $132.3 billion in response, crossing $3 trillion for the first time since January, 2025.
The RRP barely moved. The TGA was the entire story.
What made that week notable wasn’t just the size of the move. It was the context: reserves crossing $3 trillion happened not because the Fed did anything. It happened because the Treasury spent. The mechanism that had drained $500 billion in liquidity over the April tax season reversed course — and it reversed hard, in days, without a single FOMC vote.
What the Data Has Been Showing
Twelve weeks. Three rows. One recurring observation.
The dominant driver of weekly reserve balances — the number that most directly measures available banking-system liquidity — has been the Treasury General Account, a fiscal instrument, not a monetary one. The Fed met, deliberated, and held. The TGA moved over $600 billion in both directions. The plumbing ran on its own schedule.
Rather than a criticism of the Fed, I view it as a structural reality that people can miss entirely, because most financial commentary is focused on what the Fed says rather than what the plumbing does.
Starting with this issue, the series is renamed H.4.1 Liquidity Watch. The new name reflects what it actually tracks: the H.4.1 report, which captures both Fed and Treasury effects on the banking system’s reserve position. The “Watch” stays — that part is still accurate. The “Fed” goes — because the data spent twelve weeks showing us that the more interesting action has been elsewhere. It’s not changing to Treasury Liquidity Watch either, because this series should focus on the data in the H.4.1 report, and whatever it tells us.
Part 3: What’s Ahead
The TGA closed Wednesday at $807.4 billion — still well above the sub-$400 billion baseline where we started, but $199.8 billion off the April peak. Three consecutive weeks of drawdown have brought it here. The drain has more room to run.
Two things to watch: whether the TGA continues toward more historically normal levels, which would push reserves higher still, and whether the RRP’s slight uptick this week ($3.7 billion) is noise or the beginning of a new parking trend. Reserves holding above $3 trillion for a second week confirms that recent liquidity injections are staying in the system.
The debt ceiling timeline will shape what happens next. When that gets resolved, the Treasury’s ability to refill and re-drain its account changes — and so does the pace of everything tracked in this series.
The H.4.1 report is released every Thursday by the Federal Reserve. H.4.1 Liquidity Watch tracks the three figures that matter most — reserve balances, the TGA, and reverse repo — and explains what their movements mean for financial conditions.