

H.4.1 Liquidity Watch // Issue #14
The TGA Has Now Shed $225 Billion Since April — So Why Did Reserves Fall This Week?

The Weekly H.4.1 Breakdown
Issue #14 — May 20, 2026

Five consecutive weeks of TGA drawdown. The Treasury has now returned $225 billion to the banking system since the April peak. By every measure that’s been driving this series, the direction should be clear.
But this week the plumbing disagreed.
Reserves fell — the first weekly decline since the drawdown began in Issue #11. Not because the TGA stopped draining. It drained another $25.4 billion. But the reverse repo facility surged $16.3 billion in the same week, and other balance sheet dynamics absorbed the remainder. The fiscal channel kept working. The financial channel pushed back harder.
Quick Update — Week Ending May 20, 2026
Four rows from Table 1, Wednesday column:
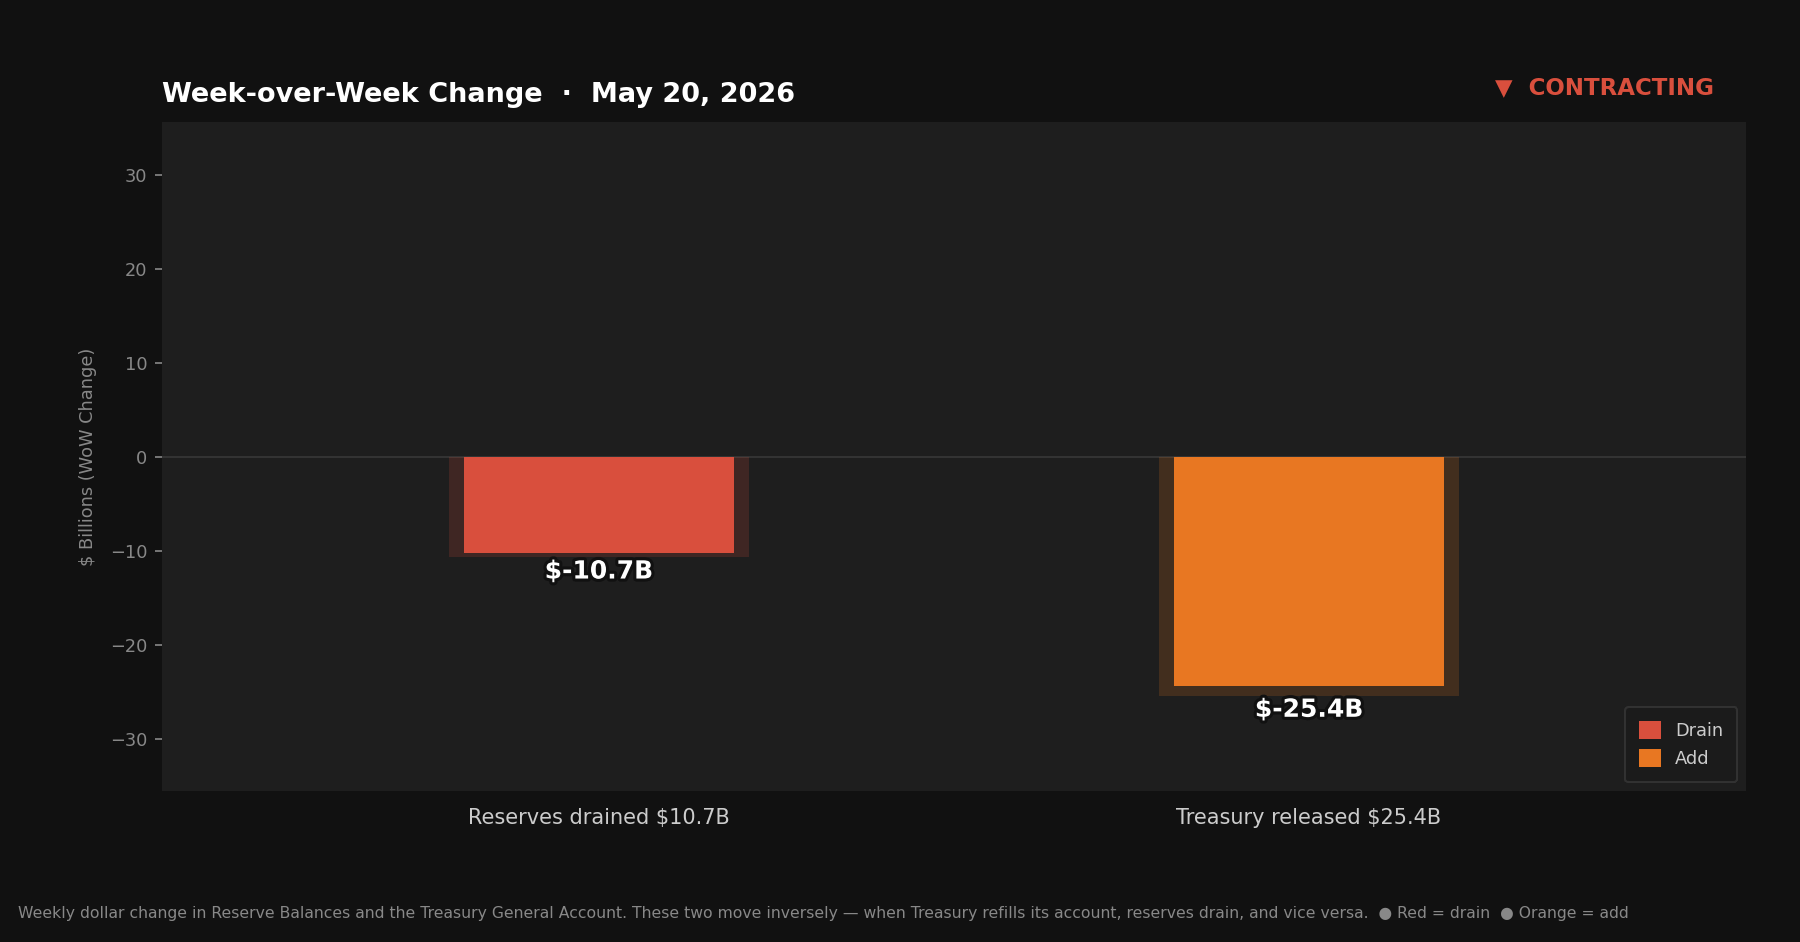
Reserve balances with Federal Reserve Banks: $3,106.7B — down $10.7B from last week
U.S. Treasury General Account (TGA): $782.0B — down $25.4B from last week
Reverse repurchase agreements (RRP): $342.6B — up $16.3B from last week
Central bank liquidity swaps: $0.0B — unchanged from last week (Normal reading: near zero. No signal.)
Why I’ve Added Swap Lines
Given the recent sovereign bond sell-off and apparent ongoing shift in the global world order, I thought it was appropriate to begin watching something that moves very infrequently, but is extremely consequential when it does.
The dollar is the world’s reserve currency, which means banks in Tokyo, Frankfurt, and London book trillions in dollar assets and liabilities. When funding markets seize, those banks need dollars their own central banks can’t print. Swap lines are how the Fed extends dollar liquidity beyond U.S. borders — lending dollars to a foreign central bank, collateralized by that central bank’s own currency, which then lends those dollars into its local banking system. The Fed carries no exchange rate or credit risk. But the result is real: new dollars in the system, offshore.
The history is consistent. The Fed deployed swap lines after September 11, peaked at over $500 billion outstanding during 2008, and reactivated them within days of the March 2020 crash. Each time, cross-currency stress collapsed and risk assets recovered.
Near zero is the normal reading. When those balances move, something is breaking — or being built.
Liquidity Signal — Week of May 20, 2026
Direction: Contracting
Primary Driver: RRP surge absorbed the TGA tailwind; reserves fell despite continued fiscal drawdown
Implication: First contracting signal since Issue #10 — the TGA drain continues but is no longer the only force in the room
4-Week Trend: Contracting for first time in 4 weeks. Prior 3 weeks: Expanding.
What Actually Happened
The week-ending TGA balance is $782.0 billion.
That’s down $25.4 billion from last week’s $807.4 billion, and down $225.2 billion from the April peak of $1.007 trillion. The drawdown is now in its fifth consecutive week. By that measure, the fiscal channel that has been expanding liquidity since Issue #11 is still running.
But reserves closed Wednesday at $3,106.7 billion — down $10.7 billion from last week. The first weekly decline since the drawdown started.
The explanation lives in the RRP. The reverse repo facility rose $16.3 billion this week to $342.6 billion. That’s money leaving the broader financial system and parking overnight at the Fed. The $25.4 billion that Treasury spent out of the TGA and into the banking system didn’t stay there — a meaningful portion of it, plus other flows, reversed course and moved into the RRP. The net effect on reserves was negative.
The swap line figure is $0.0 billion, essentially zero and unchanged. No signal there.
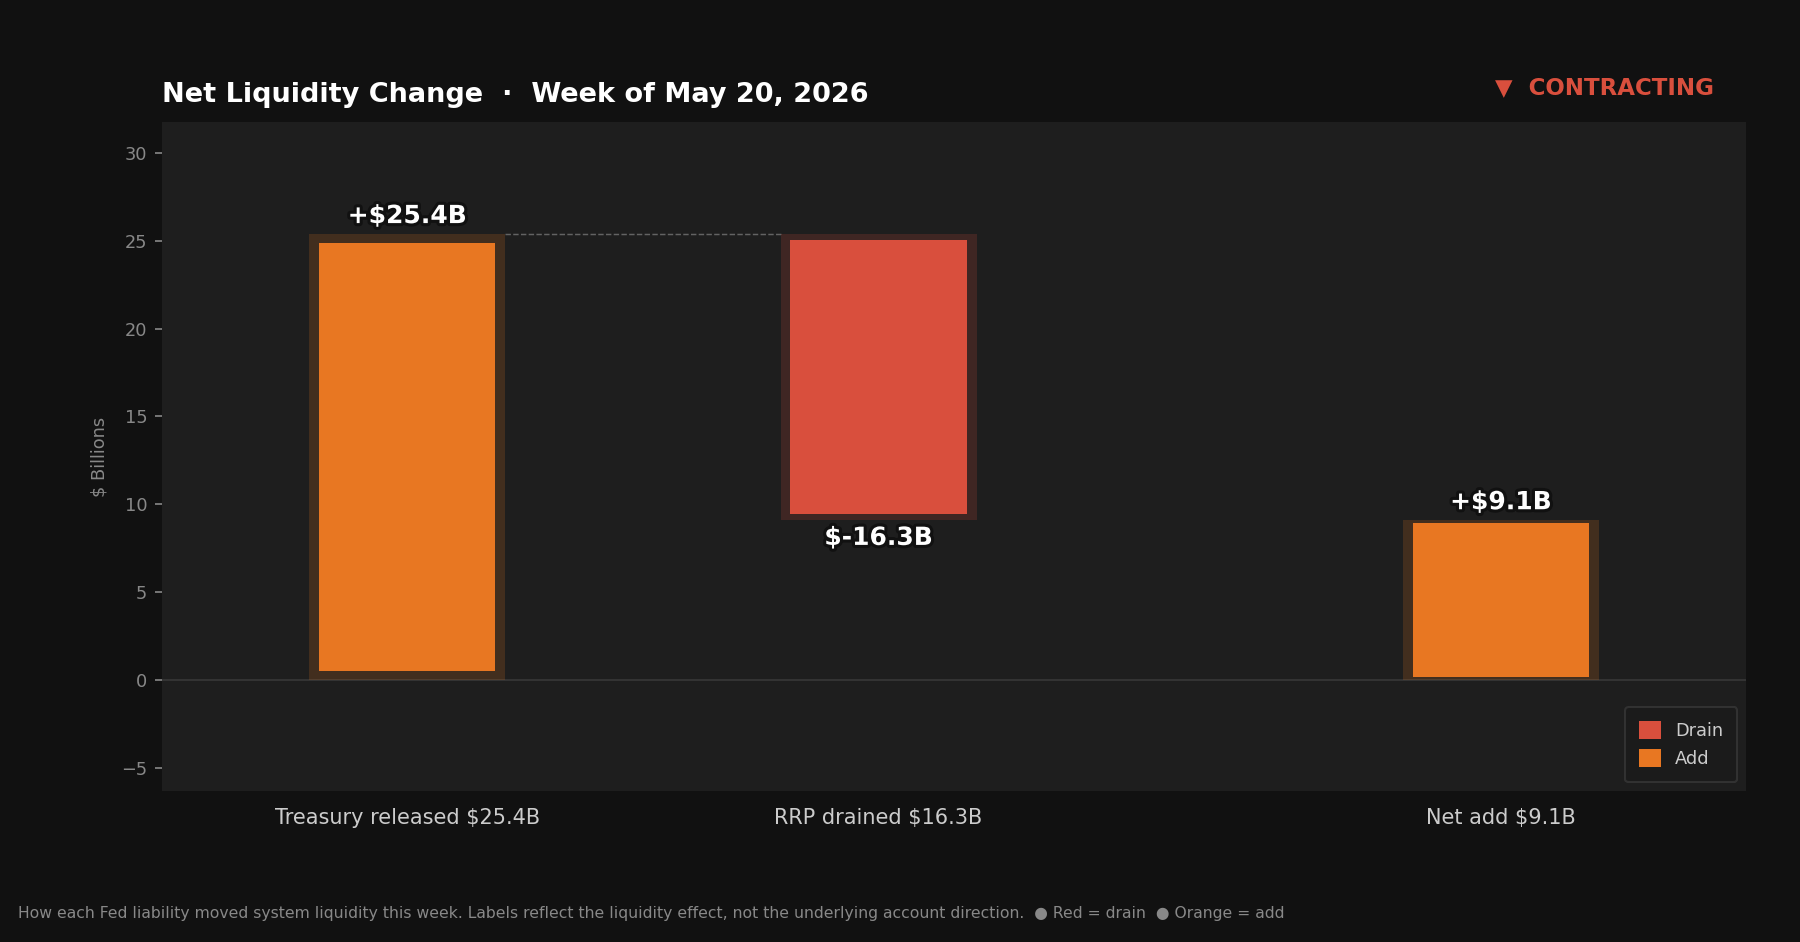
Net liquidity in the financial system, combining Treasury cash balances and reverse repo usage.
The Mechanics, Briefly
For anyone joining for the first time:
Reserve balances are what commercial banks hold at the Fed — the banking system’s collective checking account. When reserves rise, banks have more room to lend and invest. When reserves fall, that capacity tightens.
The TGA is the federal government’s checking account at the Fed. Tax receipts flow in; spending flows out. When Treasury spends, money leaves its account and lands as reserves in the banking system. The two accounts sit at opposite ends of the same seesaw — one goes down, the other goes up.
The RRP is an overnight facility where money market funds park cash at the Fed. Dollars sitting there are not in circulation. When the RRP rises, that money is moving away from the broader system and into the Fed’s overnight facility.
This week: the TGA pushed $25.4 billion toward reserves. The RRP pulled $16.3 billion back. Other balance sheet factors absorbed the rest. Reserves ended the week lower despite the fiscal tailwind.
Reserve Balances and the Treasury General Account move inversely — when Treasury refills its account, reserves drain, and vice versa.
The Counter-Current
The last four weeks of this series told a clean story. The TGA was draining. Reserves were rising. The fiscal channel was the dominant force, and the signal was expanding, every week.
This week interrupted that story — but only partially.
The TGA is still falling. Five consecutive weeks of drawdown, $225.2 billion returned to the banking system since the April peak. That trend is intact. The loaded spring that this series described at $1.007 trillion is still releasing.
What changed is that the RRP is pushing back. A $16.3 billion weekly RRP increase is the largest in several months. The reasons aren’t always visible in the H.4.1 data alone — money market funds make their own decisions about where to park cash, and the overnight rate at the Fed remains attractive enough to pull dollars back when other short-term options are less compelling. What’s visible in the data is the result: the financial channel absorbed what the fiscal channel released, and then some.
This happens. The TGA and RRP don’t always cooperate. Last week both were working in the same direction — TGA down, RRP down — and reserves hit a series high. This week only one cooperated.
The TGA drawdown since April peak:
Issue #11: $988.1B — down $19.1B from peak
Issue #12: $862.8B — down $144.4B from peak
Issue #13: $807.4B — down $199.8B from peak
Issue #14: $782.0B — down $225.2B from peak
The drawdown rate is slowing. The first three weeks released $19B, then $125B, then $55B. This week is $25B. The pace is consistent with ordinary government spending rhythms rather than any large discrete event. The remaining $382 billion above the sub-$400 billion baseline where this series began still represents future liquidity waiting to enter the system — but nothing about this week suggests the flow has stopped. It’s just facing a headwind this week.
What Didn’t Move
The Fed remained passive.
Five weeks. The TGA has swung $225 billion. The RRP has moved in both directions. Reserves have crossed $3 trillion and pulled back from the high. Not one dollar of any of it required a Fed decision.
What to Watch
The TGA is at $782.0 billion — still well above historical norms, still with room to drain. Watch whether next week’s RRP reverts toward its recent range (~$310–330B) or holds elevated; a second consecutive RRP increase would put real pressure on reserves regardless of what the TGA does. The debt ceiling timeline remains the structural variable: any near-term resolution that gives Treasury room to issue freely could alter the drawdown pace significantly in either direction.
The Bitcoin Lens
The TGA has now returned $225 billion to the banking system over five weeks. This week the RRP absorbed a portion of it before it could stay in circulation. That’s worth noting — not because it changes the long-term picture, but because it’s an honest reading of what the plumbing actually showed.
The sponge doesn’t care about weekly fluctuations in the RRP. It’s tracking the longer arc: $600 billion swung through this system in both directions since January, driven almost entirely by fiscal mechanics most people don’t know exist. Some weeks the injection sticks. Some weeks it doesn’t. The system is large and the flows interact in ways that don’t always resolve cleanly week to week.
What hasn’t changed: the supply curve. Five weeks of TGA drawdown, one week of RRP push-back, and the total supply of bitcoin remains exactly where it was. Every dollar that moves through this plumbing — whether it lands in reserves or gets parked back at the Fed overnight — is chasing a fixed ceiling. That math compounds quietly in the background, regardless of what any single week’s H.4.1 report says.