

H.4.1 Liquidity Watch // Issue # 15
The Treasury Just Pulled $60 Billion Back — This Week's Fed Report Rundown


The Weekly H.4.1 Breakdown
Issue #15 — May 27, 2026
For five consecutive weeks, this series reported TGA drawdown. Every week: money leaving Treasury’s account at the Fed, entering the banking system, reserves rising. The loaded spring, releasing.
This week the spring pulled back.
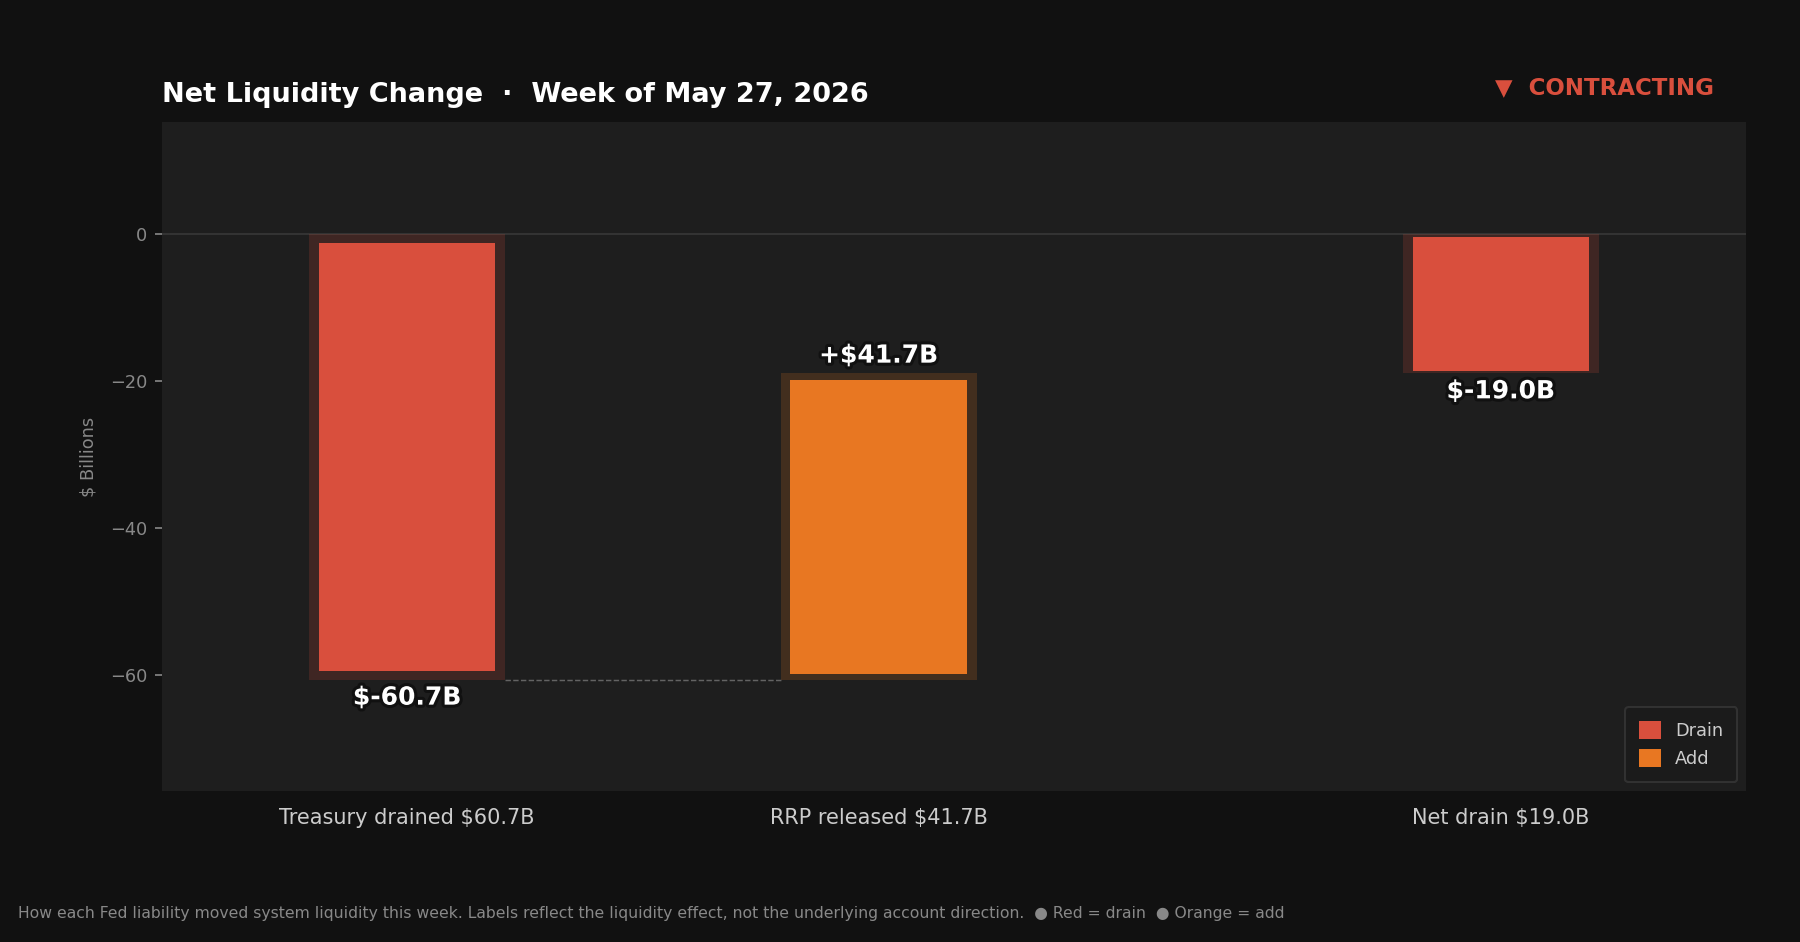
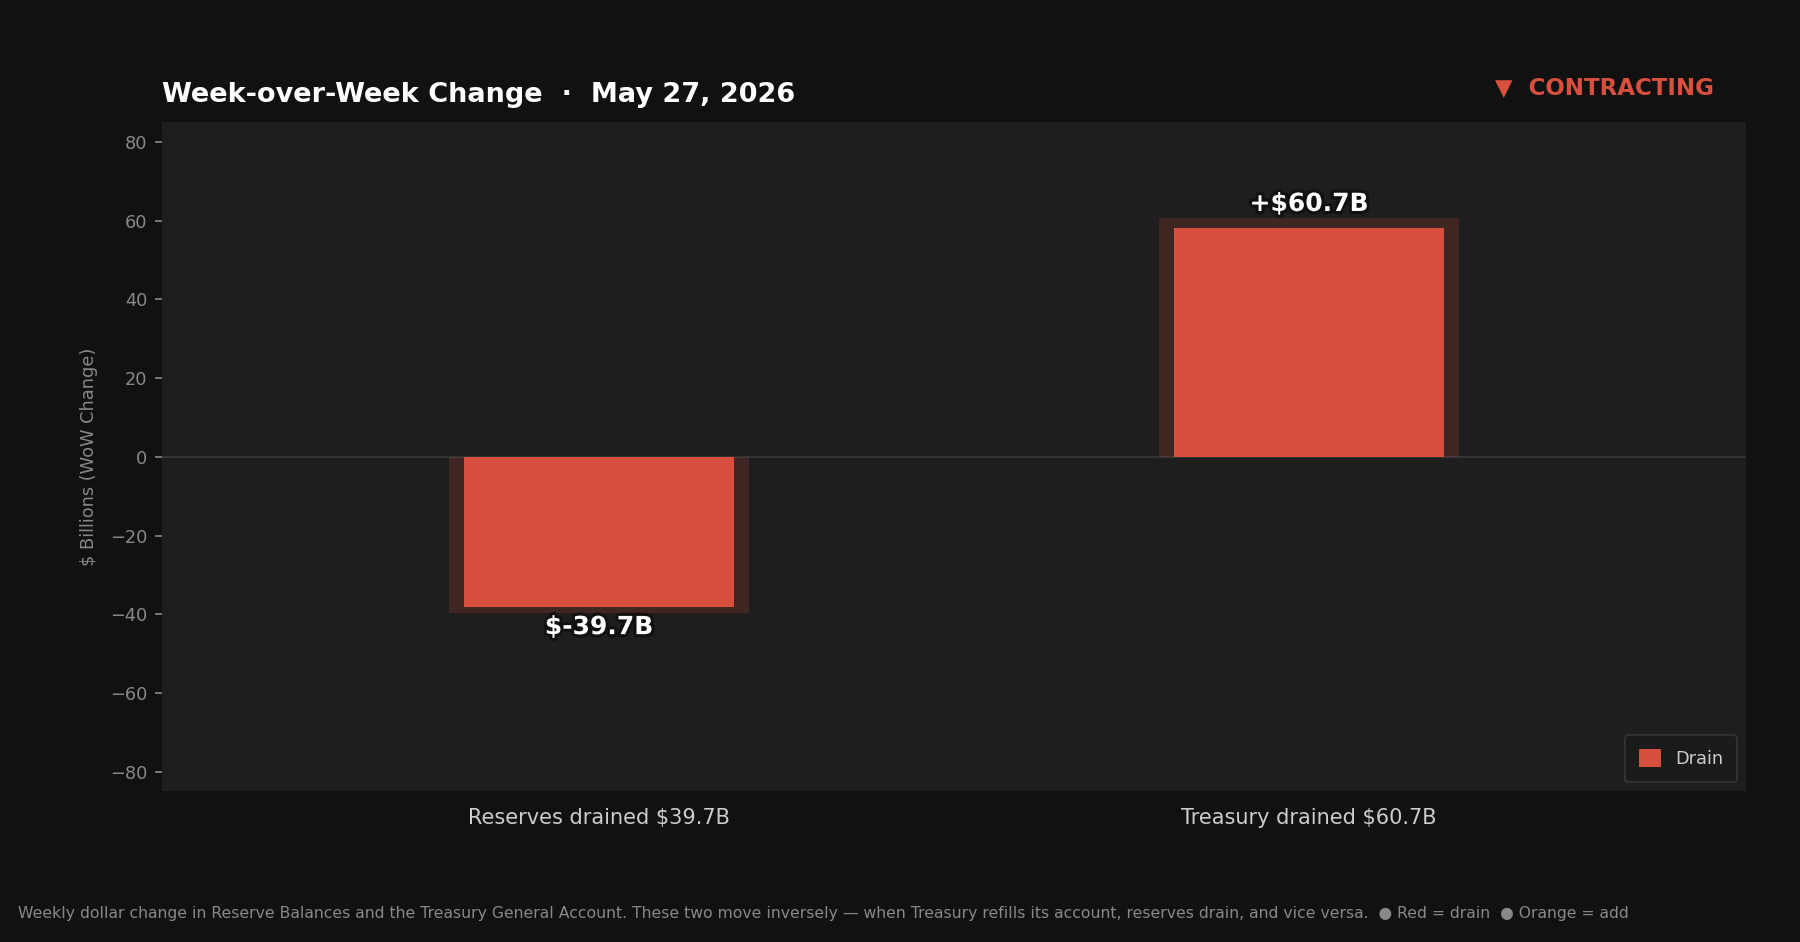
The TGA refilled $60.7 billion in a single week — the largest single-week reversal since the drawdown began after the April peak. Reserves fell $39.7 billion as a direct consequence. The reverse repo facility helped by falling $41.7 billion, but the return flow wasn’t large enough to offset what the TGA took back. The net result is a contracting signal for the second consecutive week.
Quick Update — Week of May 27, 2026
Four rows from Table 1, Wednesday column:
Reserve balances with Federal Reserve Banks: $3,067.0B — down $39.7B from last week
U.S. Treasury General Account (TGA): $842.7B — up $60.7B from last week
Reverse repurchase agreements (RRP): $300.9B — down $41.7B from last week
Central bank liquidity swaps: $0.0B — unchanged from last week (Near zero. No signal.)
Liquidity Signal — Week of May 27, 2026
Direction: Contracting
Primary Driver: TGA refilled $60.7B, draining reserves; RRP decline provided partial offset
Implication: Second consecutive contracting signal — the five-week TGA drawdown trend has reversed, at least for this week
4-Week Trend: Contracting 2 of 4 weeks. Issues #12 and #13 were expanding; #14 and #15 contracting.
What Actually Happened
The week-ending TGA balance is $842.7 billion.
That’s up $60.7 billion from last week’s $782.0 billion. After five consecutive weeks of drawdown ($225 billion returned to the banking system since the April peak of $1.007 trillion) the Treasury’s cash pile just grew by the largest single-week amount of the entire series.
When the TGA refills, Treasury is pulling money out of the banking system and back into its account at the Fed. Tax receipts, new debt issuance, seasonal flows — the causes vary week to week. The effect on reserves is mechanical: TGA up, reserves down. The seesaw swings back.
The reverse repo facility moved in the helpful direction. RRP fell $41.7 billion to $300.9 billion — money leaving the Fed’s overnight parking facility and returning to the broader banking system. That’s $41.7 billion of tailwind to reserves.
It wasn’t enough. The TGA pulled $60.7 billion in one direction. The RRP returned $41.7 billion in the other. Other balance sheet dynamics absorbed the rest. Reserves ended the week at $3.07T— down $39.7 billion from last week’s ~$3.11T.
The swap line figure is $0.0 billion, essentially zero and unchanged. No signal.
Net liquidity in the financial system, combining Treasury cash balances and reverse repo usage.
The Mechanics, Briefly
For readers joining this series for the first time:
Reserve balances are what commercial banks hold at the Fed — the banking system’s collective checking account. When reserves rise, banks have more capacity to lend and invest. When reserves fall, that capacity tightens.
The TGA is the federal government’s checking account at the Fed. Tax receipts flow in; government spending flows out. When Treasury spends, money leaves its account and enters the banking system as reserves. When Treasury refills — through tax receipts or new debt issuance — money flows the other direction. The TGA and reserves sit at opposite ends of the same seesaw.
The RRP is an overnight facility where money market funds park cash at the Fed. Dollars sitting there are not in general circulation. When RRP falls, that money returns to the broader system.
This week: the TGA pulled $60.7 billion in. The RRP sent $41.7 billion back. Other dynamics absorbed the remainder. Reserves fell $39.7 billion.
Reserve Balances and the Treasury General Account move inversely — when Treasury refills its account, reserves drain, and vice versa.
The Fed’s Two Hands
When we look at headlines regarding the Fed, they generally focus on one thing: the rate decision. And it makes sense because the fed funds rate is the Fed’s most visible lever.
But the Fed has a another lever, and it really comes down to balance sheet expansion. We see it in the news when it’s massive and specifically named quantitative easing, but not so much when comes sporadically and in various new acronyms and ‘programs’.
Since December 12, 2025, the Fed has been conducting what it calls Reserve Management Purchases (RMPs) — buying Treasury bills at roughly $40 billion per month. Add approximately $13 to $15 billion per month in ongoing mortgage-backed securities reinvestment, and the Fed is quietly putting around $53 to $55 billion per month back into the system through balance sheet operations.
These purchases don’t appear in the TGA or RRP lines tracked in this report. They land on the asset side of the Fed’s balance sheet — specifically in securities held outright, T-bill holdings, which reached $462.9 billion as of this week. Total securities held outright (SOMA) stand at $6.429 trillion.
Michael Howell has described this activity as “not QE QE.” The distinction is meaningful. Traditional quantitative easing means large-scale purchases designed to dramatically expand the balance sheet and push reserves into the system. What’s happening now is more targeted: the Fed is buying T-bills to keep reserves from falling below the level needed for smooth market functioning. It slows the drain, but doesn’t reverse it. The mechanics are similar even if the stated intent is different.
The practical read: the rate hand is stationary because the Fed is holding rates steady. The balance sheet hand is active because its been buying T-bills every week since December. When you read that “the Fed did nothing this week,” that description covers one hand. The other has been at work all year, quietly adding reserves into a system that the TGA just drained back out.
Without those purchases running in the background, this week’s reserve decline would have been larger.
What to Watch
The TGA is back at $842.7 billion after five weeks of drawdown. Whether this week’s refill is a one-time reversal or the start of a new accumulation phase will determine the next few signals. A return to TGA drawdown next week would push toward expanding; continued refilling deepens the contracting trend. The RRP at $300.9 billion still has room to fall further and any additional decline would provide a partial offset. The debt ceiling timeline is the structural variable: resolution that gives Treasury more room to issue freely could shift the TGA trajectory in either direction with little warning.
The Bitcoin Lens
Dollars moved through this system in several directions this week. The TGA pulled $60.7 billion out of the banking system. The RRP sent $41.7 billion the other way. The Fed’s balance sheet added reserves quietly in the background through ongoing RMP purchases. All of it is real, and when moves are large enough, they show up in Bitcoin’s price.
But zooming out changes what you’re looking at.
The system requires dollars to run — not just today’s dollars, but more dollars, always. The debt underpinning the global financial system never stops growing and never stops needing to be serviced. The TGA rises and falls. The RRP ebbs and flows. The Fed’s balance sheet expands and pauses. These are the week-to-week mechanics. The long-run direction of the system they serve is not flat.
Bitcoin sits on the other side of that equation. Fixed supply. No issuer. No mechanism to expand. In the short run, it moves up, down, and sideways. Tracking sentiment, liquidity cycles, and whatever the TGA happened to do this week. In the long run, Bitcoin’s price in dollars goes one direction because the total dollars in the system goes one direction.