

H.4.1 Liquidity Watch // Issue # 18
The Fed's Balance Sheet Just Lost $175 Billion in a Single Week. Here's Why.


The Weekly H.4.1 Breakdown
Issue #18 — June 17, 2026
One week of expanding. Back to contracting.
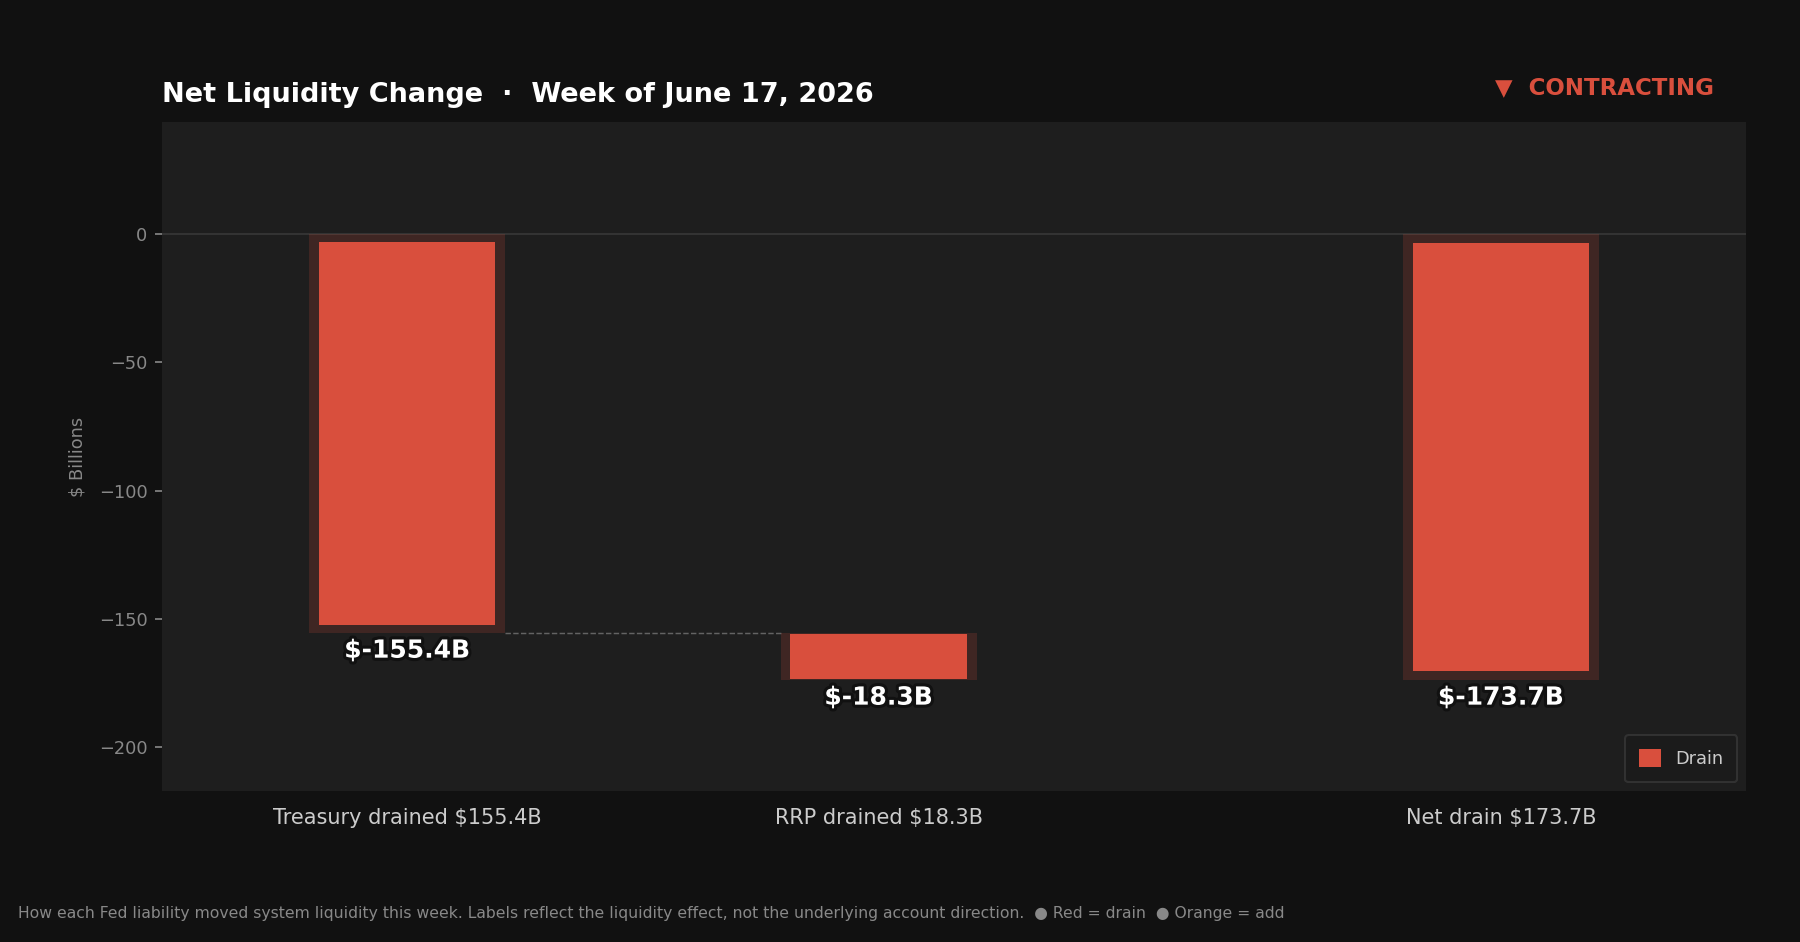
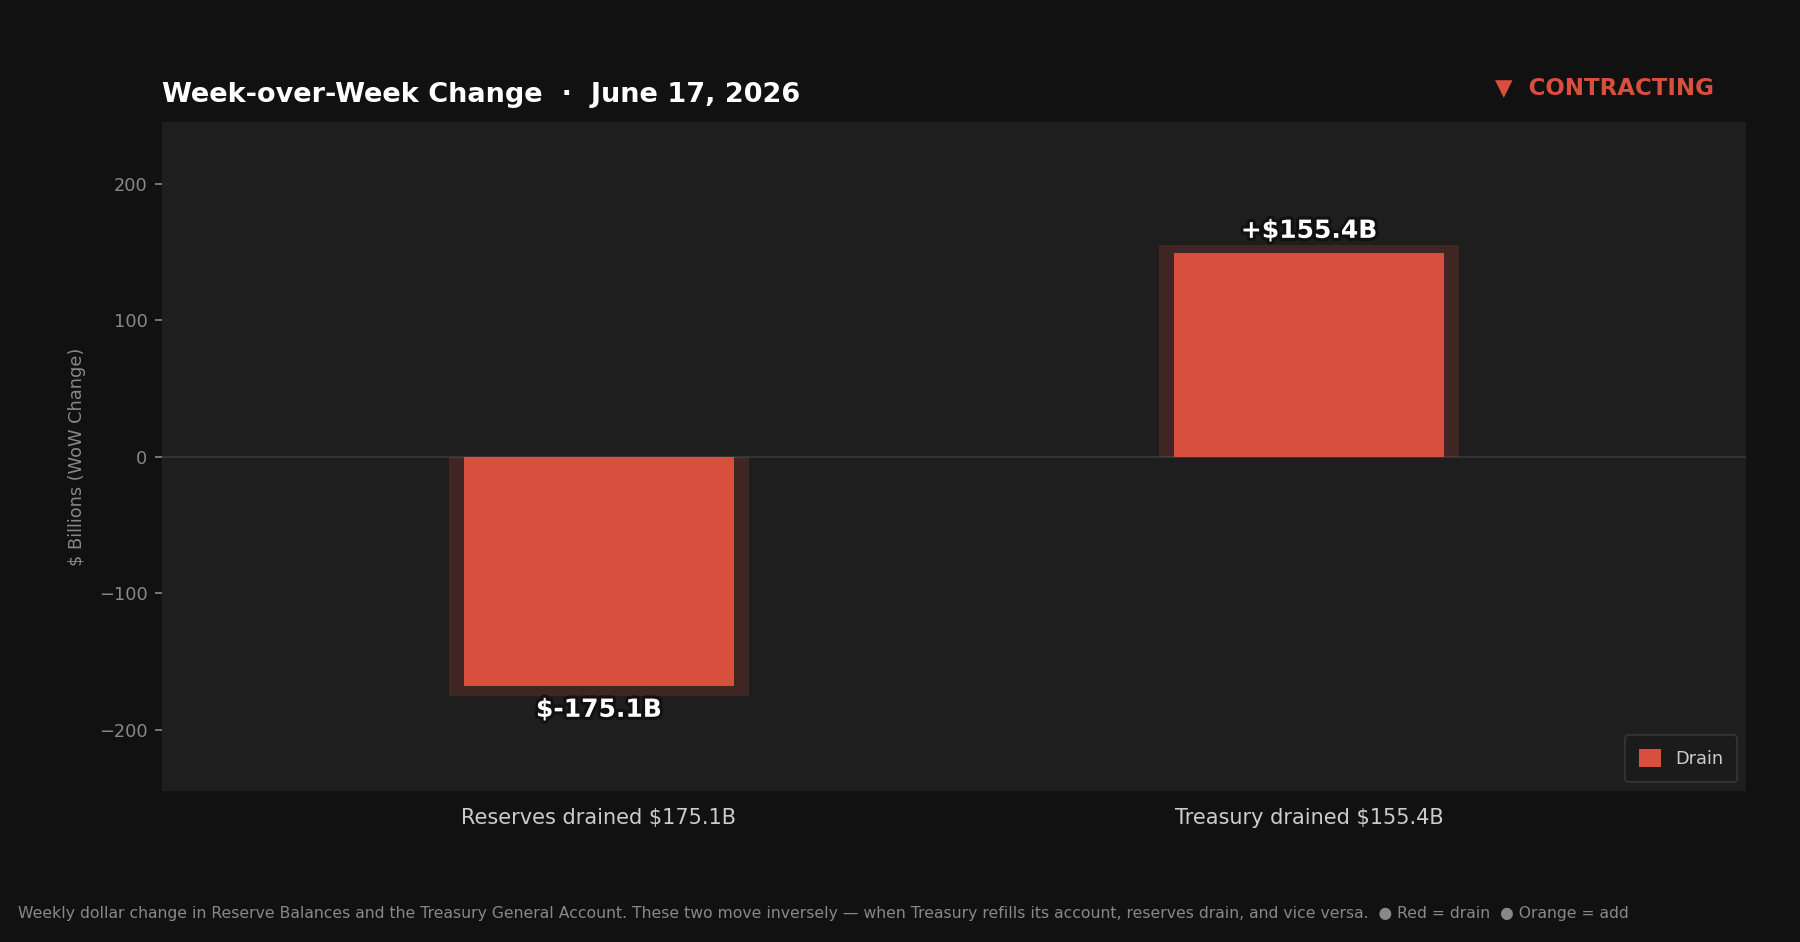
The TGA rebuilt $155.4 billion. The RRP added $18.3 billion on top of that. Reserves fell $175.1 billion. Whatever relief last week’s reversal offered, Treasury just took most of it back — and then some.
Quick Update — Week ending June 17, 2026
Four rows from Table 1, Wednesday column:
Reserve balances with Federal Reserve Banks: $2,936.4B — down $175.1B from last week
U.S. Treasury General Account (TGA): $956.5B — up $155.4B from last week
Reverse repurchase agreements (RRP): $335.6B — up $18.3B from last week
Central bank liquidity swaps: $0.0B — near zero, no signal
Liquidity Signal — Week ending June 17, 2026
Direction: Contracting
Primary Driver: TGA rebuilt $155.4B — Treasury pulled cash back into its account faster than it spent it out
Implication: Reserves dropped $175.1B, the largest single-week move in this series; RRP rose alongside the TGA rather than offsetting it
4-Week Trend: Contracting 3 of 4 weeks — last week’s expanding signal was the outlier.
What Actually Happened
The TGA ended the week at $956.5 billion — up $155.4 billion from last week’s $801.1 billion. That’s the largest weekly TGA move this series has tracked. Treasury collected faster than it spent, and the banking system felt it.
When Treasury’s account at the Fed grows, that money comes from somewhere — tax receipts, bond proceeds — and it leaves the banking system to get there. Every dollar that lands in the TGA is a dollar that was, until that moment, sitting in someone’s bank account as a reserve balance. A $155.4 billion refill is a $155.4 billion withdrawal from the system’s lending capacity.
The RRP moved the same direction, which is the part worth sitting with. Last week the overnight facility held $317.3 billion. This week it sits at $335.6 billion — up $18.3 billion. Instead of providing a tailwind like it did last week, money market funds pulled more cash off the table and parked it at the Fed overnight. Combined, the TGA and RRP pulled $173.7 billion out of circulation before any offsets.
The Fed’s ongoing T-bill purchases ran quietly in the background, but at a slower pace than recent weeks. T-bill holdings rose $6.6 billion to $486.0 billion. Total securities held outright (SOMA) now stands at $6.454 trillion. The math: $173.7 billion drained by TGA and RRP, partly offset by roughly $6.6 billion from T-bill purchases, lands you near a $167 billion net drain — against an actual reserve drop of $175.1 billion. The remaining gap is rounding and minor other factors, same as every week.
Net liquidity in the financial system, combining Treasury cash balances and reverse repo usage.
The Mechanics, Briefly
For readers joining this series for the first time:
Reserve balances are what commercial banks hold at the Fed — the banking system’s collective checking account. When reserves rise, banks have more capacity to lend and invest. When reserves fall, that capacity tightens.
The TGA is the federal government’s checking account at the Fed. Tax receipts flow in; government spending flows out. When Treasury spends, money leaves its account and enters the banking system as reserves. When Treasury refills, money flows the other direction. The TGA and reserves sit at opposite ends of the same seesaw.
The RRP is an overnight facility where money market funds park cash at the Fed. Dollars sitting there are not in general circulation. When RRP falls, that money returns to the broader system. When RRP rises, that money exits.
This week: the TGA grew $155.4 billion. The RRP grew $18.3 billion. T-bill purchases added approximately $6.6 billion. Reserves fell $175.1 billion.
Reserve Balances and the Treasury General Account move inversely — when Treasury refills its account, reserves drain, and vice versa.
The Fed’s Two Hands
Most coverage of the Fed focuses on the rate decision. That hand has been stationary, and this week it stayed exactly where everyone expected. Kevin Warsh ran his first meeting as chair. Rates held at 3.50–3.75%.
What actually got attention was what Warsh chose not to do. He skipped the dot plot entirely — the first sitting chair to abstain from submitting his own rate projection — and the post-meeting statement dropped forward guidance altogether. His stated reason:
“As a general proposition, forward guidance isn’t the business we should be in.”
Of the eighteen projections that were submitted, nine officials see at least one more hike this year, eight see rates holding steady, and one sees a cut. That’s not a committee with a plan. It’s a committee with a disagreement, and Warsh seems to think pretending otherwise was never the point.
This series has never tracked what the Fed says it might do. It tracks what already happened — the TGA, the RRP, the reserves, the purchases. A sentence about the future rate path can be walked back at the next speech. A Wednesday balance sheet entry can’t. A Fed chair openly skeptical of forward guidance is, in his own way, admitting what this report has been built on for eighteen issues: the data holds up better than the language wrapped around it.
Since December 12, 2025, the Fed has been conducting Reserve Management Purchases — buying Treasury bills to manage the size of its balance sheet. The pace has slowed meaningfully since the program’s early run rate of roughly $40 billion per month. This week’s $6.6 billion addition continues that slower trend, down from the $9.8 billion added the week before.
These purchases don’t appear in the TGA or RRP lines tracked in this report. They land on the asset side of the Fed’s balance sheet, in T-bill holdings — which reached $486.0 billion this week, up from $479.3 billion. Total securities held outright (SOMA) stands at $6.454 trillion.
This week, the RMPs were a footnote next to the fiscal story. The TGA and RRP did essentially all of the draining, and the Fed’s purchases barely dented it. When both fiscal levers move the same direction at this scale, the monetary side can’t keep up.
What to Watch
The TGA at $956.5 billion is now well above its recent range, and the question is whether Treasury keeps collecting or starts spending it back out. The RRP’s move alongside the TGA — rather than against it, as it did last week — is the more interesting signal heading into quarter-end; if money market funds keep adding to the facility through June 30, that’s two consecutive drains compounding rather than offsetting. Watch whether next week’s TGA reading reverses or extends, since a second large refill would mark a genuine shift rather than a one-week fiscal quirk.
The Bitcoin Lens
A $175.1 billion drop in reserves is the kind of number that gets attention. It’s also one week, in a series that’s now shown four different configurations of the same three numbers in four different weeks.
What this report tracks isn’t really about any single week. The TGA fills and empties because the government collects and spends — both are necessary. The RRP rises and falls because money market funds chase whatever yield exists at any given moment. The Fed buys T-bills to manage the size of its own balance sheet. None of these mechanisms exist to expand or contract liquidity on purpose — they’re the side effects of running a government and a banking system that both depend on a currency with no fixed limit.
That’s the part that doesn’t change week to week. The total stock of dollars in the system has nowhere to go but up over time, because the system that issues them has no mechanism to stop. Bitcoin has the opposite property — a hard ceiling, reached on a fixed schedule, with no committee that can vote to change it. The long-run direction of the dollars is the long-run direction of Bitcoin’s price.