

H.4.1 Liquidity Watch // Issue #19
The TGA drew down $54.7B and reserves recovered $18.1B — but four weeks of perfect alternation make this week's expanding signal harder to trust than it looks.


The Weekly H.4.1 Breakdown
Issue #19 — Week ending June 24, 2026
The TGA spent $54.7 billion back out this week. Reserves recovered $18.1 billion. The signal flipped to expanding — for the second time in two weeks.
Four straight weeks. Four different signals. That pattern is the story.
Quick Update — Week ending June 24, 2026
Four rows from Table 1, Wednesday column:
Reserve balances with Federal Reserve Banks: $2,954.5B — up $18.1B from last week
U.S. Treasury General Account (TGA): $901.8B — down $54.7B from last week
Reverse repurchase agreements (RRP): $336.5B — up $0.9B from last week
Central bank liquidity swaps: $0.0B — near zero, no signal
Liquidity Signal — Week of June 24, 2026
Direction: Expanding
Primary Driver: TGA drew down $54.7B, returning cash to the banking system after last week’s record refill
Implication: Reserves rose $18.1B; the gap between TGA drawdown and reserve gain reflects normal plumbing friction — not all Treasury spending reaches bank reserves directly or immediately
4-Week Trend: Alternating — Contracting / Expanding / Contracting / Expanding — four consecutive weeks, no sustained direction
What Actually Happened
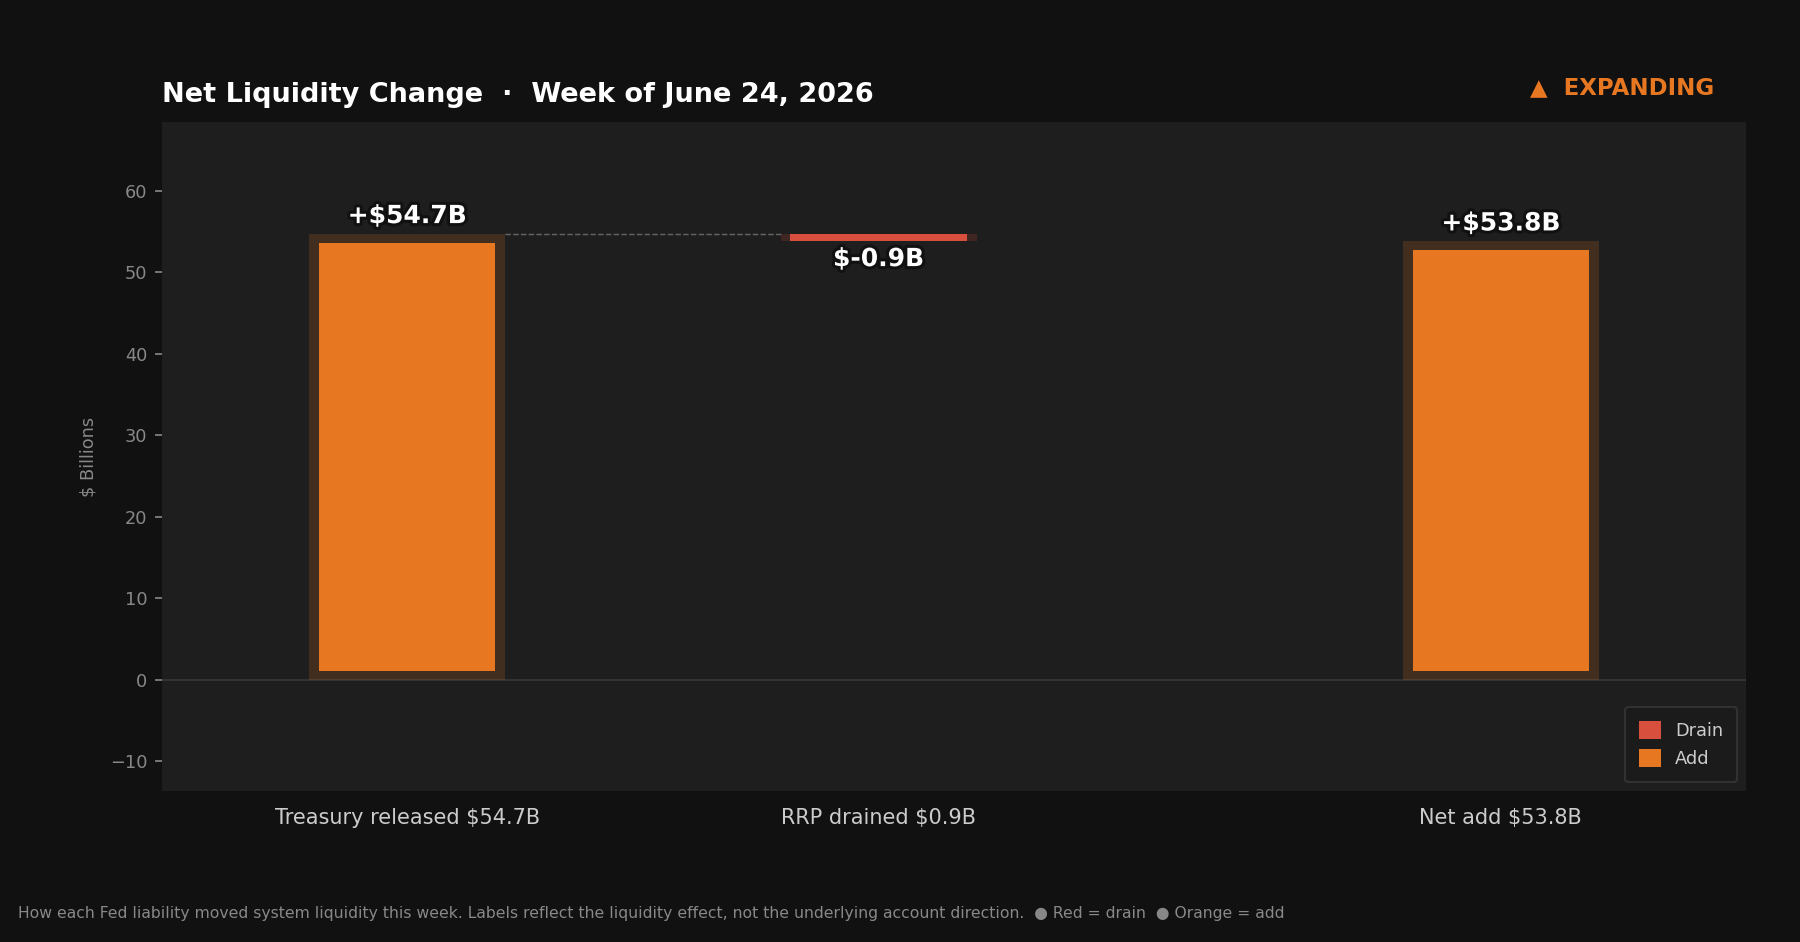
The TGA finished the week at $901.8 billion — down $54.7 billion from last week’s $956.5 billion. Treasury spent. Cash left the government’s account and moved back into the financial system.
When that happens, the mechanics are straightforward: money sitting in the TGA is inert. It’s at the Fed, removed from circulation. Money leaving the TGA goes somewhere active. Banks see it arrive as reserve balances, which expands their capacity to lend and invest. Reserves rose $18.1 billion to $2,954.5 billion, confirming the expansion directionally.
But here’s the gap worth noting. If the TGA fell $54.7 billion, reserves should have risen by something closer to that. They didn’t. The $36 billion difference went primarily into “other” deposits at the Fed — accounts held by government-sponsored enterprises, international organizations, and similar entities. This isn’t unusual. Not all Treasury spending routes directly to commercial bank reserve accounts; some flows through intermediate stops before reaching reserves, or doesn’t reach them at all. Think of it as friction loss in the pipe. The cash moved — just not entirely to where reserves are counted.
The RRP barely registered. At $336.5 billion, the overnight facility added $0.9 billion on the week. That’s noise. Money market funds weren’t pulling cash back into circulation, but they weren’t adding meaningfully to the drain either. The RRP sat on the sidelines.
Net liquidity in the financial system, combining Treasury cash balances and reverse repo usage.
The Mechanics, Briefly
For readers joining this series for the first time:
Reserve balances are what commercial banks hold at the Fed — the banking system’s collective checking account. When reserves rise, banks have more capacity to lend and invest. When reserves fall, that capacity tightens.
The TGA is the federal government’s checking account at the Fed. Tax receipts and bond proceeds flow in; government spending flows out. When Treasury spends, money leaves its account and enters the banking system as reserves. When Treasury refills, money flows the other direction. The TGA and reserves sit at opposite ends of the same seesaw.
The RRP is an overnight facility where money market funds park cash at the Fed. Dollars sitting there are not in general circulation. When RRP falls, that money returns to the broader system. When RRP rises, that money exits.
This week: TGA fell $54.7 billion. RRP rose $0.9 billion. The Fed’s T-bill purchases — which have been quietly adding to the balance sheet since December as part of the Reserve Management Purchase program — paused entirely. T-bill holdings held flat at $485.974 billion. Total securities held outright edged down $2.4 billion as mortgage-backed securities continued their slow, scheduled runoff. The Fed’s footprint barely moved this week. The entire story was Treasury.
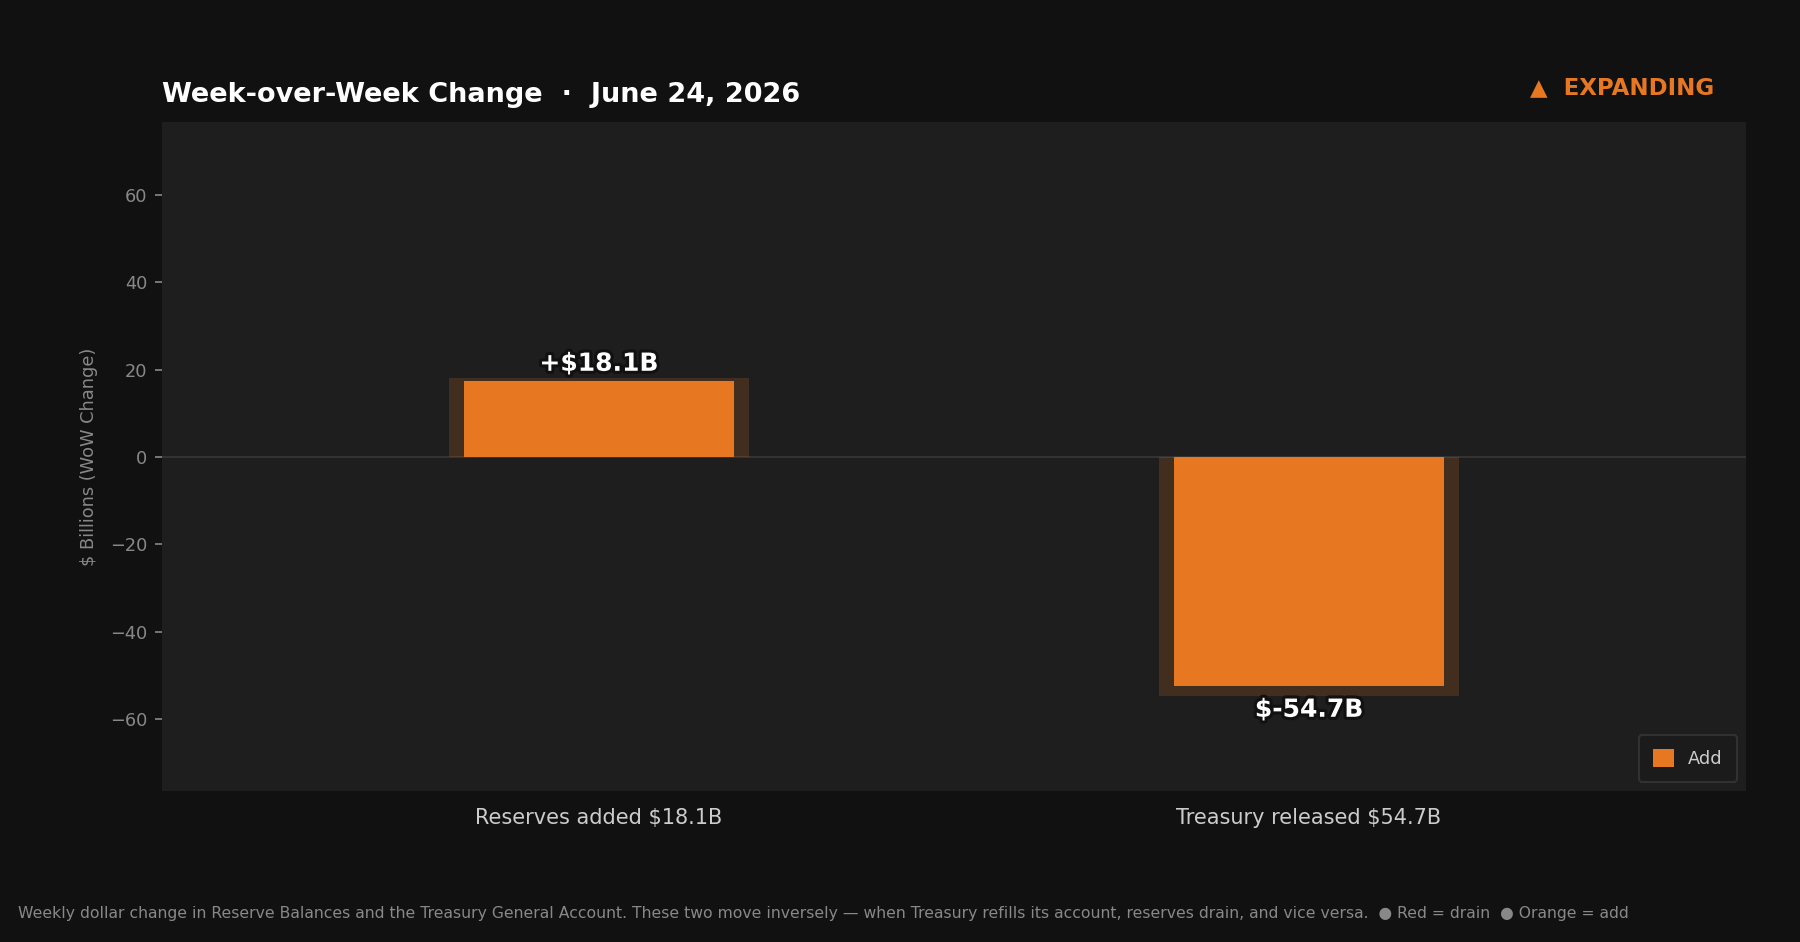
Reserve Balances and the Treasury General Account move inversely — when Treasury refills its account, reserves drain, and vice versa.
Four Weeks, No Trend
There’s a pattern in the signal history that’s harder to see when you’re reading week-to-week:
IssueWeek OfSignal#16June 3Contracting#17June 10Expanding#18June 17Contracting#19June 24Expanding
Contracting. Expanding. Contracting. Expanding. Perfect alternation across four consecutive weeks. That’s not a trend — it’s oscillation. The numbers have been moving sharply in both directions because the TGA has been at historically elevated levels and moving fast in either direction as Treasury’s fiscal mechanics play out.
Look at the TGA over that same window: $862 billion, then up to $956 billion — a series record in a single week — then back to $901 billion. Those are large swings. They produce loud signals that point opposite directions on alternating weeks, which is exactly what happened.
A signal that flips every week doesn’t give you much to work with directionally. What it does tell you is that the dominant variable (the TGA) is oscillating rather than trending. That’s the relevant structural fact heading into the next few weeks. The noise is high. Look through it.
What to Watch
Quarter-end is June 30 — six days out from the Wednesday data in this report. Two forces typically converge around fiscal quarter-ends: Treasury often accelerates spending as the period closes, which would push the TGA lower and reserves higher. Money market funds sometimes load up the RRP for balance-sheet window dressing through the quarter close, which would drain reserves in the other direction. If both happen simultaneously, they’ll roughly offset. If only one moves, next week’s report will be the cleanest liquidity read in a month.
The T-bill purchase pause also deserves a follow. The Reserve Management Purchase program has been adding bills at a pace of roughly $5–10 billion per week since December. This week it went to zero. One pause doesn’t mean the program is decelerating — but two consecutive weeks of zero or near-zero additions would be a meaningful shift worth tracking.
The Bitcoin Lens
Four weeks of alternating signals is the data telling you something honest: there is no trend right now. The TGA is the loudest driver in the system and it’s been moving in both directions. Reserves have swung accordingly. Reading a sustained directional bias from this month’s H.4.1 data requires more confidence than the data justifies.
That’s the nature of the short run. The machinery of a reserve currency is complicated, and three numbers don’t always compose a clean story week to week. Last week’s $155 billion refill was real. This week’s $54 billion drawdown was also real. They pulled in opposite directions, and the signal followed.
The long run is simpler. The TGA sits at $901.8 billion — still well above historical norms. It will be spent. When it is, more dollars reach the banking system and the baseline stock of dollars in circulation moves higher. That’s not a prediction about any particular week. It’s a description of how the system works. Bitcoin has no TGA, no reservoir of additional supply waiting to be released into circulation, no committee setting the pace, no week-to-week oscillation in its total count. The long-run direction of the dollars is the long-run direction of Bitcoin’s price. IMO, that’s the only story that matters in the end.