

H.4.1 Liquidity Watch // Issue #20
Why Fed Reserve Balances Surged $122 Billion at Quarter-End — And What It Means


The Weekly H.4.1 Breakdown
Issue #20 — July 4, 2026
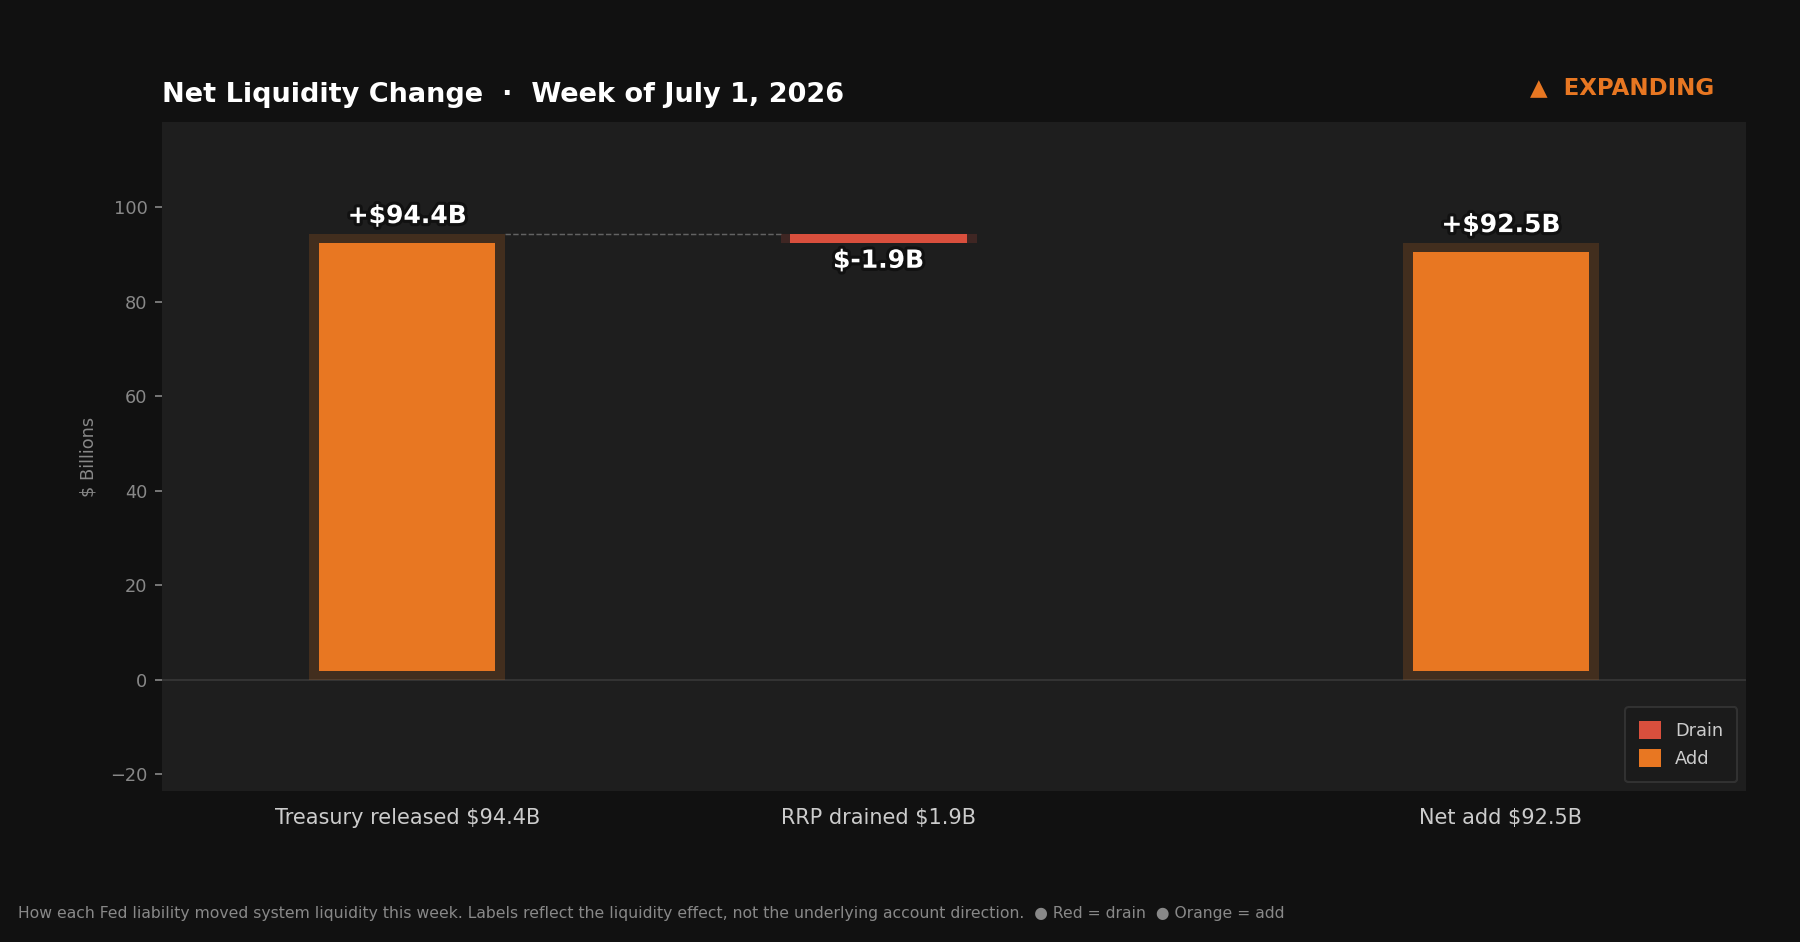
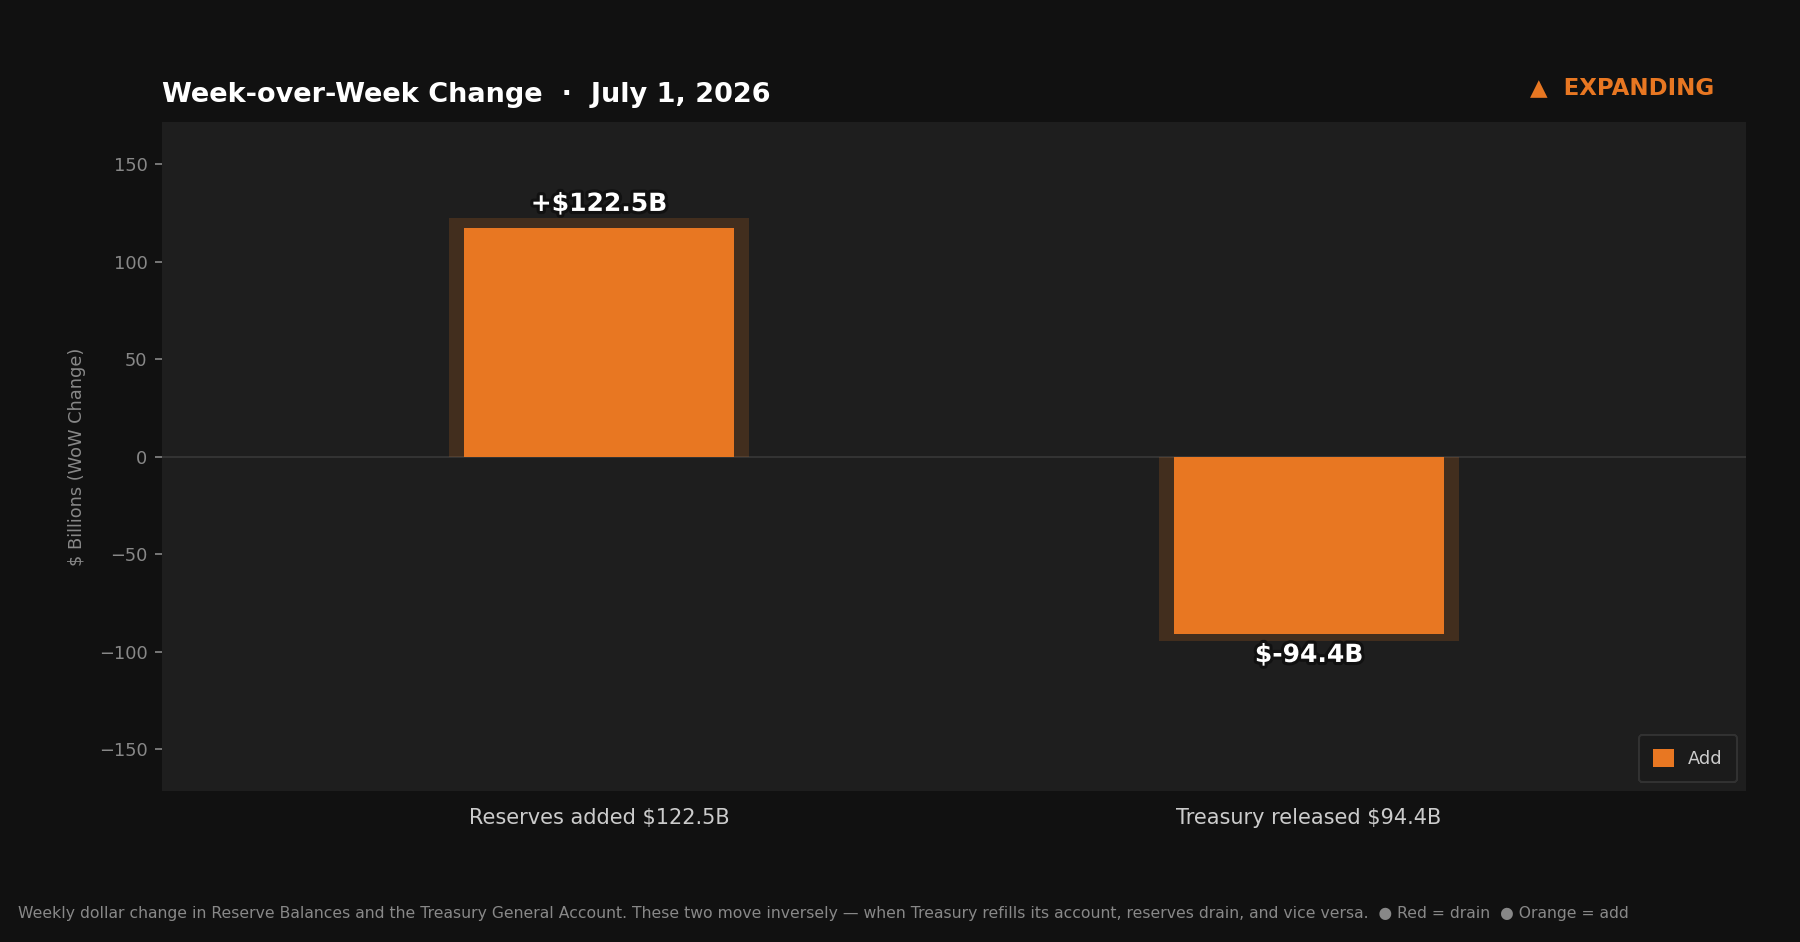
Quarter-end showed up in the data. The TGA fell $94.4 billion. Reserves jumped $122.5 billion. Two consecutive expanding signals — the first time since May.
Last week’s report called two possible outcomes at quarter-end: Treasury spending that would push the TGA lower, or money market fund window dressing that would push the RRP higher. Treasury moved decisively. The RRP barely registered.
Quick Update — Week ending July 1, 2026
Four rows from Table 1, Wednesday column:
Reserve balances with Federal Reserve Banks: $3,077.0B — up $122.5B from last week
U.S. Treasury General Account (TGA): $807.4B — down $94.4B from last week
Reverse repurchase agreements (RRP): $338.4B — up $1.9B from last week
Central bank liquidity swaps: $0.3B — near zero, no signal
Liquidity Signal — Week ending July 1, 2026
Direction: Expanding
Primary Driver: TGA drew down $94.4B — quarter-end Treasury spending returned a large slug of cash to the banking system
Implication: Reserves rose $122.5B, exceeding the TGA decline; the difference reflects resumed Fed T-bill purchases and movements in other Fed deposit accounts
4-Week Trend: Contracting / Expanding / Contracting / Expanding — two consecutive expanding signals, the alternating pattern has broken
What Actually Happened
The TGA ended the week at $807.4 billion — down $94.4 billion from $901.8 billion last week. Treasury spent through the quarter-end, and the cash flowed back into the banking system as reserves.
The scale of the drawdown is the headline. A $94 billion outflow from the TGA in a single week is large. The TGA peaked at $956.5 billion three weeks ago — a series record — and has now come down $149 billion from that high. Treasury refilled at a historic pace, then started spending at a meaningful one. The direction of travel has changed.
One number invites scrutiny. If the TGA fell $94.4 billion, reserves should have risen by something close to that. They rose $122.5 billion — about $28 billion more than the TGA decline alone can explain. The RRP’s $1.9 billion increase actually subtracted from reserves rather than adding to them. So where did the extra come from?
Two places. The Fed’s Reserve Management Purchase program, which had paused its T-bill additions last week, appears to have resumed — T-bill holdings in the SOMA portfolio rose approximately $3.3 billion. The remainder likely reflects movements in other deposits at the Fed: accounts held by foreign officials, GSEs, and international organizations that move without appearing in the four headline figures. When those accounts draw down, their cash reaches the banking system as reserves. This week, they did.
The RRP nearly confirmed last week’s window-dressing concern and then didn’t. At $338.4 billion, the overnight facility added just $1.9 billion on the week. Money market funds chose not to park large amounts at the Fed ahead of the quarter close. That’s the dog that didn’t bark.
Net liquidity in the financial system, combining Treasury cash balances and reverse repo usage.
The Mechanics, Briefly
For readers joining this series for the first time:
Reserve balances are what commercial banks hold at the Fed — the banking system’s collective checking account. When reserves rise, banks have more capacity to lend and invest. When reserves fall, that capacity tightens.
The TGA is the federal government’s checking account at the Fed. Tax receipts and bond proceeds flow in; government spending flows out. When Treasury spends, money leaves its account and enters the banking system as reserves. When Treasury refills, money flows the other direction. The TGA and reserves sit at opposite ends of the same seesaw.
The RRP is an overnight facility where money market funds park cash at the Fed. Dollars sitting there are not in general circulation. When RRP falls, that money returns to the broader system. When RRP rises, that money exits.
This week: TGA fell $94.4 billion. RRP rose $1.9 billion. The Fed resumed T-bill purchases after last week’s pause — T-bill holdings moved from approximately $485.9 billion to $489.3 billion. MBS continued its slow scheduled runoff. The dominant force by a wide margin was the TGA.
Reserve Balances and the Treasury General Account move inversely — when Treasury refills its account, reserves drain, and vice versa.
Two in a Row
The four-week alternating pattern that ran from June 3 through June 24 — Contracting, Expanding, Contracting, Expanding — has now been interrupted.
Two consecutive expanding signals for the first time since May. The oscillation was the story for a month. Now it’s stopped oscillating — at least for one week.
The context matters. The alternating pattern was driven by a TGA moving sharply in both directions at historically unusual levels. The record $956.5 billion refill produced a massive contracting signal. The subsequent drawdowns produced the expanding signals. What looked like market noise was really one large account bouncing at high levels.
At $807.4 billion, the TGA is still well above historical norms — the long-run average runs closer to $300–400 billion. The reservoir is still full. It has declined from a record high, not trended to normal. Whether this week marks the start of a genuine drawdown trend, or whether the TGA refills again on the back of new auction proceeds, determines how many consecutive expanding signals this series sees.
What to Watch
The Independence Day holiday falls Saturday, July 4 — settlement timing for Treasury spending and money market operations may be slightly compressed around the holiday. Next week’s data should be read with that in mind.
The TGA trajectory deserves the closest attention. At $807.4 billion, it has drawn down $149 billion from the record high over three weeks. Normal Treasury spending from this level implies substantial additional cash returning to the banking system over the coming weeks. Timing is sensitive to debt ceiling mechanics, tax receipt flows, and auction calendars — but the direction of travel is clear: the TGA needs to come down from historically elevated levels, and that process generates reserve expansion as it goes.
The RMP’s resumption is worth tracking separately. T-bill purchases restarted after one week off. If the pace returns to the $5–10 billion per week range that characterized the program from December through May, it adds a steady secondary source of reserve creation that operates independently of the TGA.
The Bitcoin Lens
Two consecutive expanding signals change the character of what the H.4.1 data is saying.
One expanding signal in a month of alternation is noise. Two in a row begins to look like a direction. The TGA’s descent from a record high, combined with a Fed that restarted T-bill purchases, points toward a regime where reserves are structurally better supported than they were in June.
The H.4.1 series tracks Fed-level plumbing — one layer of a larger global liquidity picture. The 13-week clock I’ve been watching through Michael Howell’s global liquidity framework was set in April, when liquidity accelerated sharply. That clock is ringing now. The Fed data is adding a domestic liquidity tailwind at the same moment the global framework was projecting a bounce window.
Whether that tailwind is strong enough to sustain a move, or whether the deceleration in global liquidity growth since April limits the ceiling, is a different question. The TGA is still an $807 billion reservoir. The long-run direction of that cash reaching the banking system is not in question. The timing is.