



The Weekly H.4.1 Breakdown
Issue #21 — July 9, 2026
Three expanding signals in a row. The TGA fell another $58.2 billion, reserves rose $60.4 billion, and the drawdown from the record high has now reached $207 billion over four weeks. A new variable showed up: the RRP jumped $10.1 billion — the largest single-week increase in several months. It moderated the expanding signal but didn’t reverse it.
The story this week is the TGA and what $207 billion returning to the banking system looks like over time. The RRP is worth watching to see whether the holiday-week uptick was one-time or the beginning of something new.
Quick Update — Week ending July 8, 2026
Four rows from Table 1, Wednesday column:
Reserve balances with Federal Reserve Banks: $3,137.4B (~$3.14T) — up $60.4B from last week
U.S. Treasury General Account (TGA): $749.2B — down $58.2B from last week
Reverse repurchase agreements (RRP): $348.5B — up $10.1B from last week
Central bank liquidity swaps: $0.2B — near zero, no signal
Liquidity Signal — Week ending July 8, 2026
Direction: Expanding
Primary Driver: TGA drew down $58.2B — Treasury spending continued returning cash to the banking system
Implication: Reserves rose $60.4B; the RRP’s $10.1B increase absorbed some of the TGA’s liquidity addition but didn’t offset it. Net effect: reserves higher, system more liquid
4-Week Trend: Contracting / Expanding / Expanding / Expanding — three consecutive expanding signals; TGA drawdown has been the dominant force. RRP rose meaningfully this week for the first time in months.
What Actually Happened
The TGA ended the week at $749.2 billion — down $58.2 billion from $807.4 billion. Treasury continued spending, and cash kept flowing back into the banking system as reserves. Since the record high of $956.5 billion set in mid-June, the TGA has now drawn down $207.3 billion across four weeks.
To put that in context: the long-run average for the TGA sits around $300–400 billion. At $749.2 billion, the government’s account is still about $350 billion above historical norms. The drawdown has been substantial. So has the amount that’s still left to come down.
Now for the arithmetic. The TGA fell $58.2 billion. The RRP rose $10.1 billion — and when the RRP rises, that cash is parked at the Fed overnight rather than circulating in the banking system, so it works against reserves. Net of those two, the expected reserve increase was roughly $48.1 billion. Actual reserves rose $60.4 billion — about $12.3 billion more than the TGA-and-RRP math alone would predict.
The gap points to the same place it has the past few weeks: other deposit accounts at the Fed. Foreign official accounts, government-sponsored enterprises, and international organizations hold balances at the Federal Reserve that don’t appear in the four headline figures. When those accounts draw down, their cash reaches the banking system as reserves. This week, they added a secondary push in the same direction as the TGA.
The RRP’s $10.1 billion increase is the week’s standout number. Last week it rose just $1.9 billion. The week before, it barely moved. A $10.1 billion single-week jump is the most meaningful RRP increase this series has tracked in several months. The timing matters: this Wednesday was the first full settlement day of the week following the July 4 holiday. Money market funds routinely adjust positions in the days around a shortened holiday week — parking cash at the Fed overnight while repositioning, then pulling it back as operations normalize. Whether this week’s RRP increase reflects that temporary adjustment, or the beginning of a more persistent trend toward higher facility usage, is the key question for next week’s data.
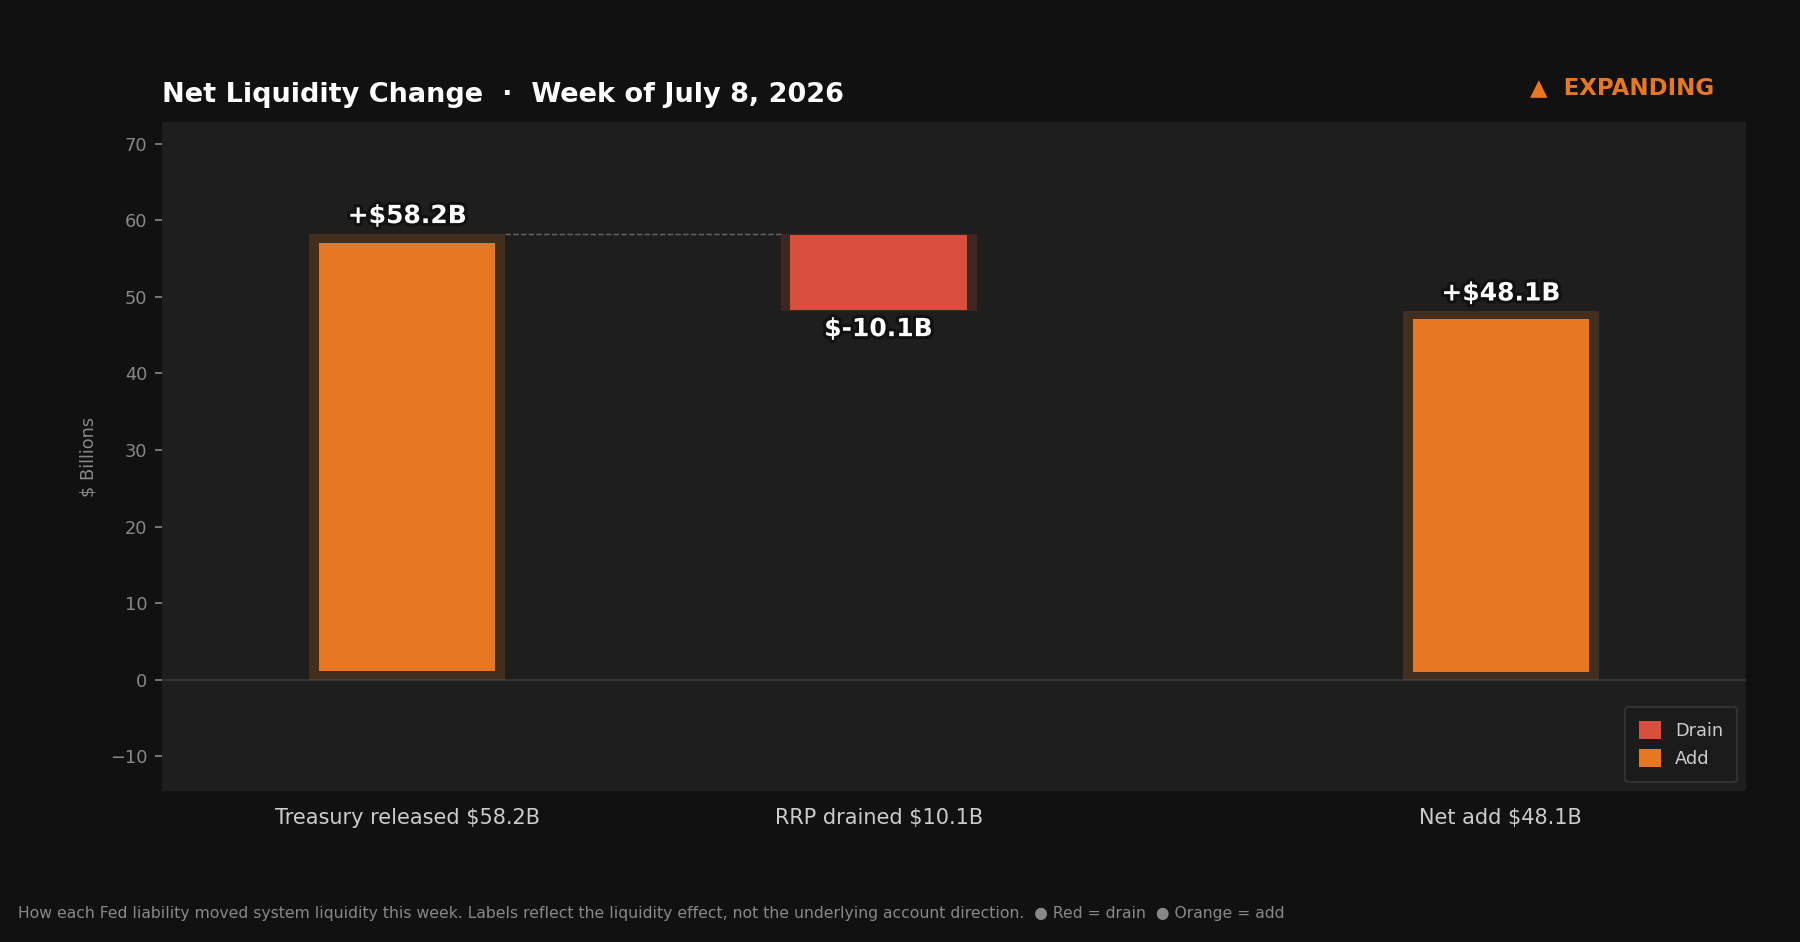
Net liquidity in the financial system, combining Treasury cash balances and reverse repo usage.
The Mechanics, Briefly
For readers joining this series for the first time:
Reserve balances are what commercial banks hold at the Fed — the banking system’s collective checking account. When reserves rise, banks have more capacity to lend and invest. When reserves fall, that capacity tightens.
The TGA is the federal government’s checking account at the Fed. Tax receipts and bond proceeds flow in; government spending flows out. When Treasury spends, money leaves its account and enters the banking system as reserves. When Treasury refills, money flows the other direction. The TGA and reserves sit at opposite ends of the same seesaw.
The RRP is an overnight facility where money market funds park cash at the Fed. Dollars sitting there are not in general circulation. When RRP falls, that money returns to the broader system. When RRP rises, that money exits.
This week: TGA fell $58.2 billion. RRP rose $10.1 billion — partially absorbing the TGA’s liquidity addition. Other deposit accounts at the Fed added approximately $12.3 billion on net. The dominant force was still the TGA, but the RRP’s uptick added a layer of complexity that hasn’t been present in recent weeks.
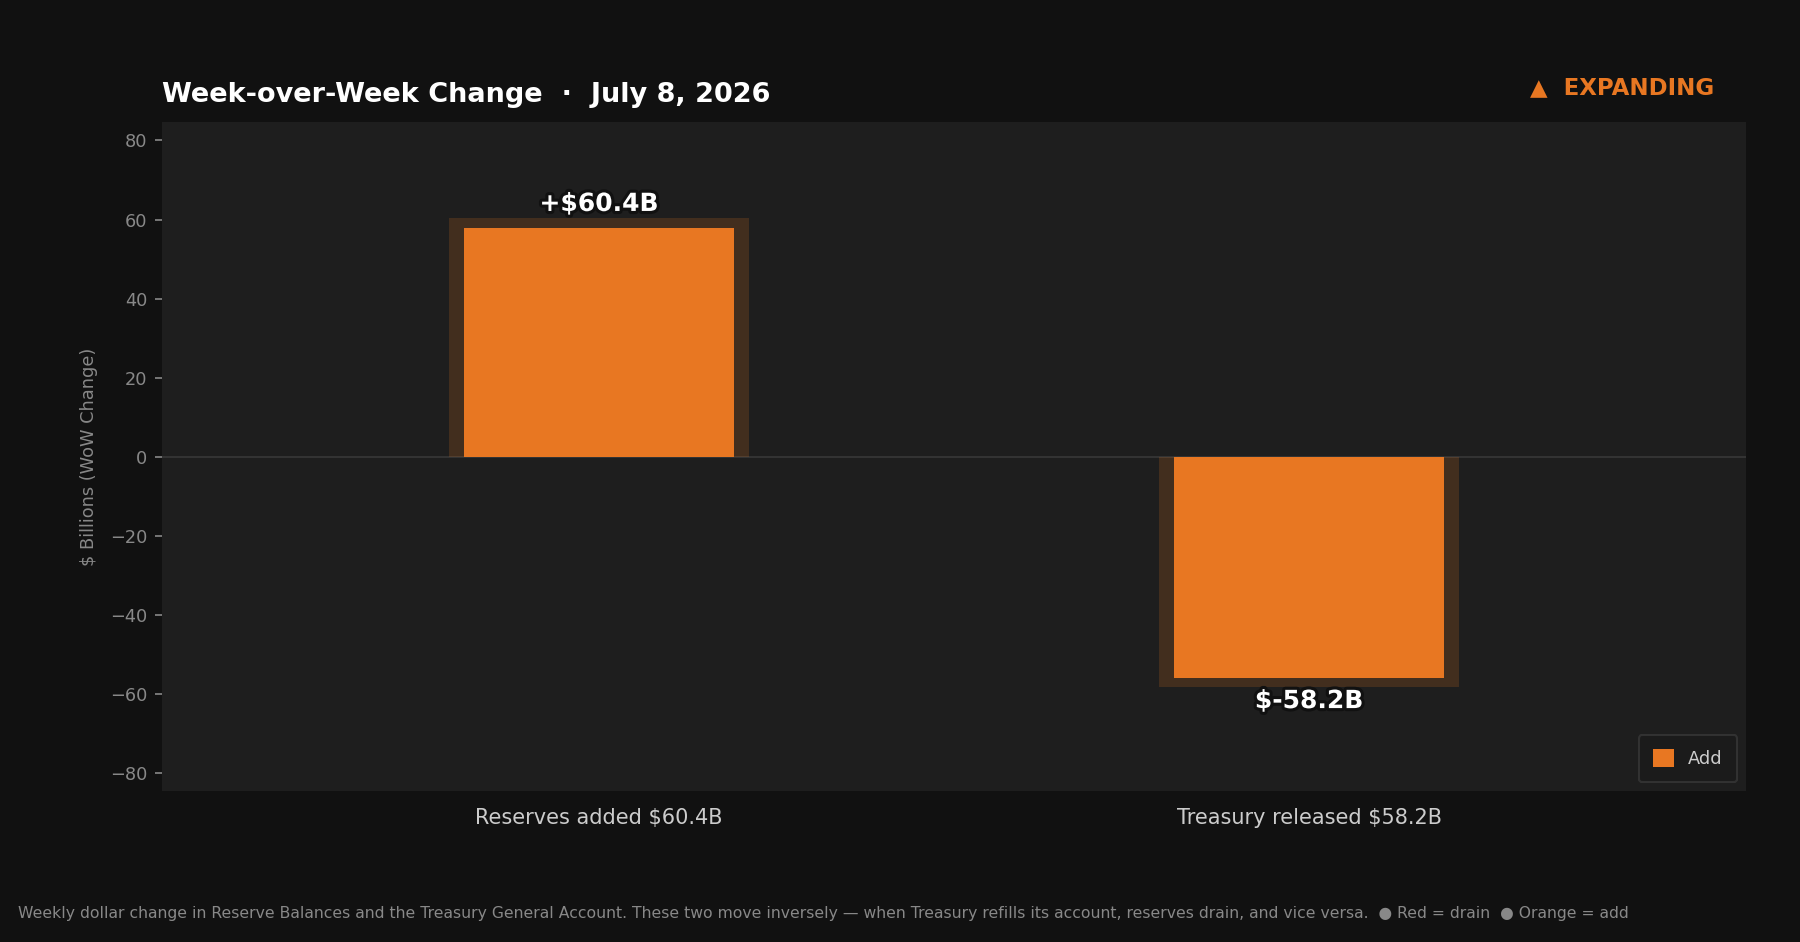
Reserve Balances and the Treasury General Account move inversely — when Treasury refills its account, reserves drain, and vice versa.
Three in a Row
Here’s where the signal history now stands:
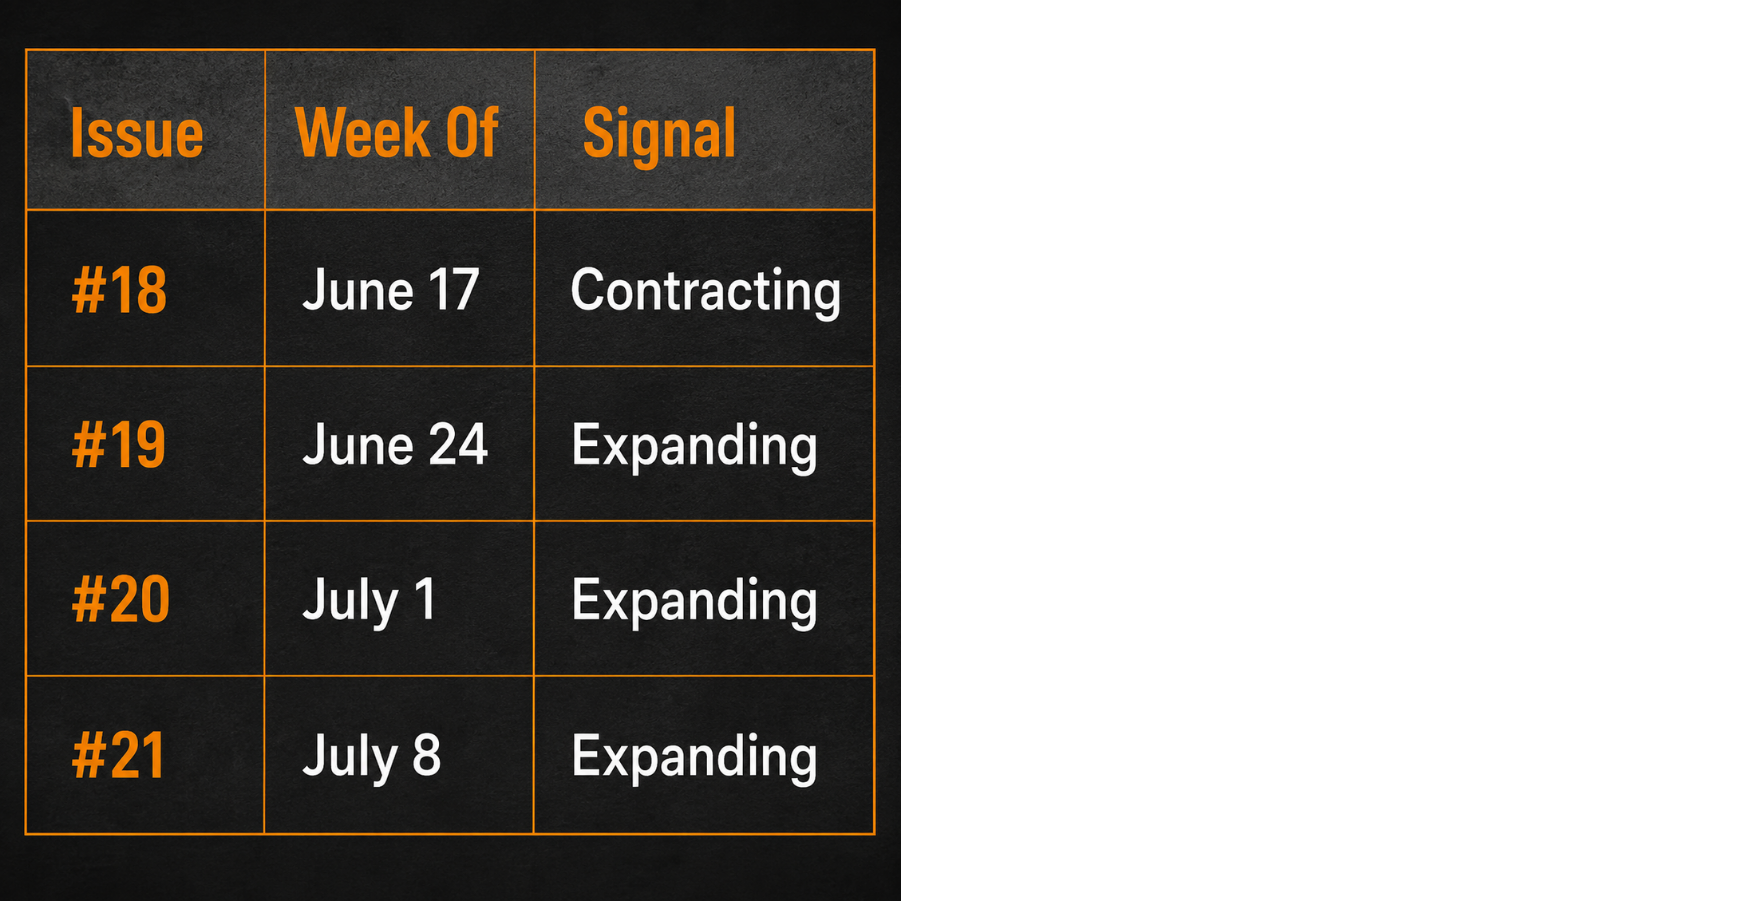
Three consecutive expanding signals. One contraction in four weeks, and it was three weeks ago.
The context: each of the past three expanding signals has been driven by the same source — the TGA drawing down from its record high. The June 24 week, the July 1 quarter-end week, and now July 8. Three different weeks, same direction, same driver. That kind of consistency in the underlying cause tends to be more durable than a signal driven by short-lived technical factors.
The TGA’s trajectory from $956.5 billion to $749.2 billion represents $207 billion of cash that has moved from the government’s account at the Fed into the banking system. That process has been orderly and consistent. It hasn’t required any policy change, any Fed action, or any market disruption. Treasury has simply been spending, and the plumbing has been working as designed.
What changes the story is either a TGA refill — new auction proceeds that reverse the drawdown — or a sustained RRP increase that catches enough of the outflow to neutralize it. Neither appears imminent, but the RRP’s move this week is a reminder that the signal has components working in different directions even when the headline reads Expanding.
What to Watch
The RRP is the key data point for next week. If the $10.1 billion increase was post-holiday noise, the facility should drift back toward the $338–340 billion range and the TGA’s drawdown will flow more cleanly into reserves. If the RRP holds at $348 billion or higher, money market funds are structurally shifting more cash to the Fed — which would dampen the expanding signal even as the TGA continues declining.
The TGA itself has room to fall further. At $749.2 billion, it remains roughly $350 billion above historical norms. The pace of the drawdown has been $50–90 billion per week over the past month. If that cadence holds, the TGA could reach more normal levels within four to six weeks — though timing depends on new auction proceeds, tax flows, and debt ceiling mechanics that are difficult to forecast precisely.
Watch also for any signals from Treasury about issuance composition. If upcoming auctions are weighted toward longer-duration securities rather than T-bills, it could affect how quickly auction proceeds cycle back into the TGA and at what pace they drain back out.
The Bitcoin Lens
Three consecutive expanding signals from the Fed’s plumbing. The TGA has returned $207 billion to the banking system over four weeks. Reserves are now $60 billion higher than they were last week and nearly $270 billion higher than they were six weeks ago.
Short-run, these moves matter to risk assets including Bitcoin. Reserve expansions of this scale — sustained, consistent, coming from a known and predictable source — create the kind of background liquidity conditions that tend to support asset prices. The 13-week lead from April’s global liquidity acceleration that I’ve been tracking through Michael Howell’s framework is ringing now. The Fed’s domestic plumbing is adding a second pulse in the same direction.
None of that tells you what Bitcoin will do this week or next. It tells you the liquidity environment that surrounds all assets is presently more generous than it was in June.
Zoom out further and the picture doesn’t change — it just gets clearer. The TGA exists because the government collects taxes and issues debt. The debt the government issues grows every year. The system that issues that debt creates more dollars in the process. The H.4.1 report is, in one sense, a weekly accounting of the machinery that generates those dollars — the same machinery that has been expanding the money supply for decades, will expand it next decade, and cannot stop without triggering a collapse that no policymaker is willing to allow.
Bitcoin’s supply is fixed. The dollar supply is not. The long-run direction of Bitcoin’s price in dollars is the logical conclusion of that asymmetry.