

H.4.1 Liquidity Watch // Issue #22
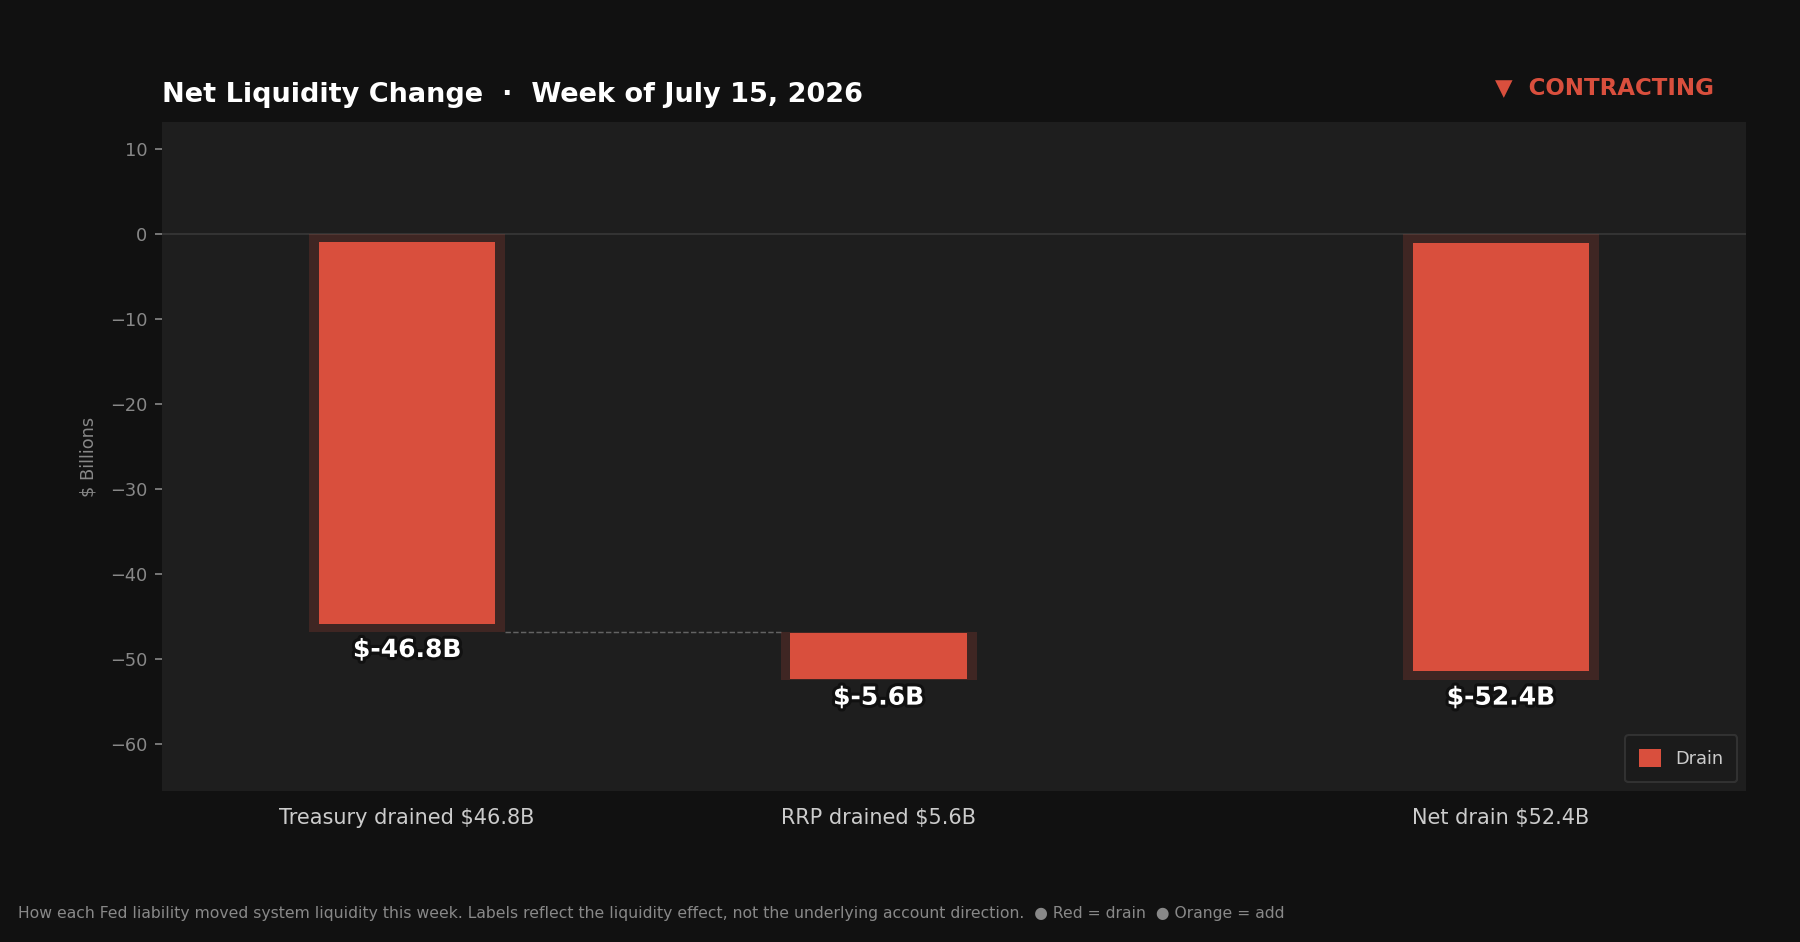
The TGA refilled $46.7B and the RRP rose for the second consecutive week — both draining reserves at once, ending the three-week expanding streak with a double-barreled contraction.


The Weekly H.4.1 Breakdown
Issue #22 — July 16, 2026
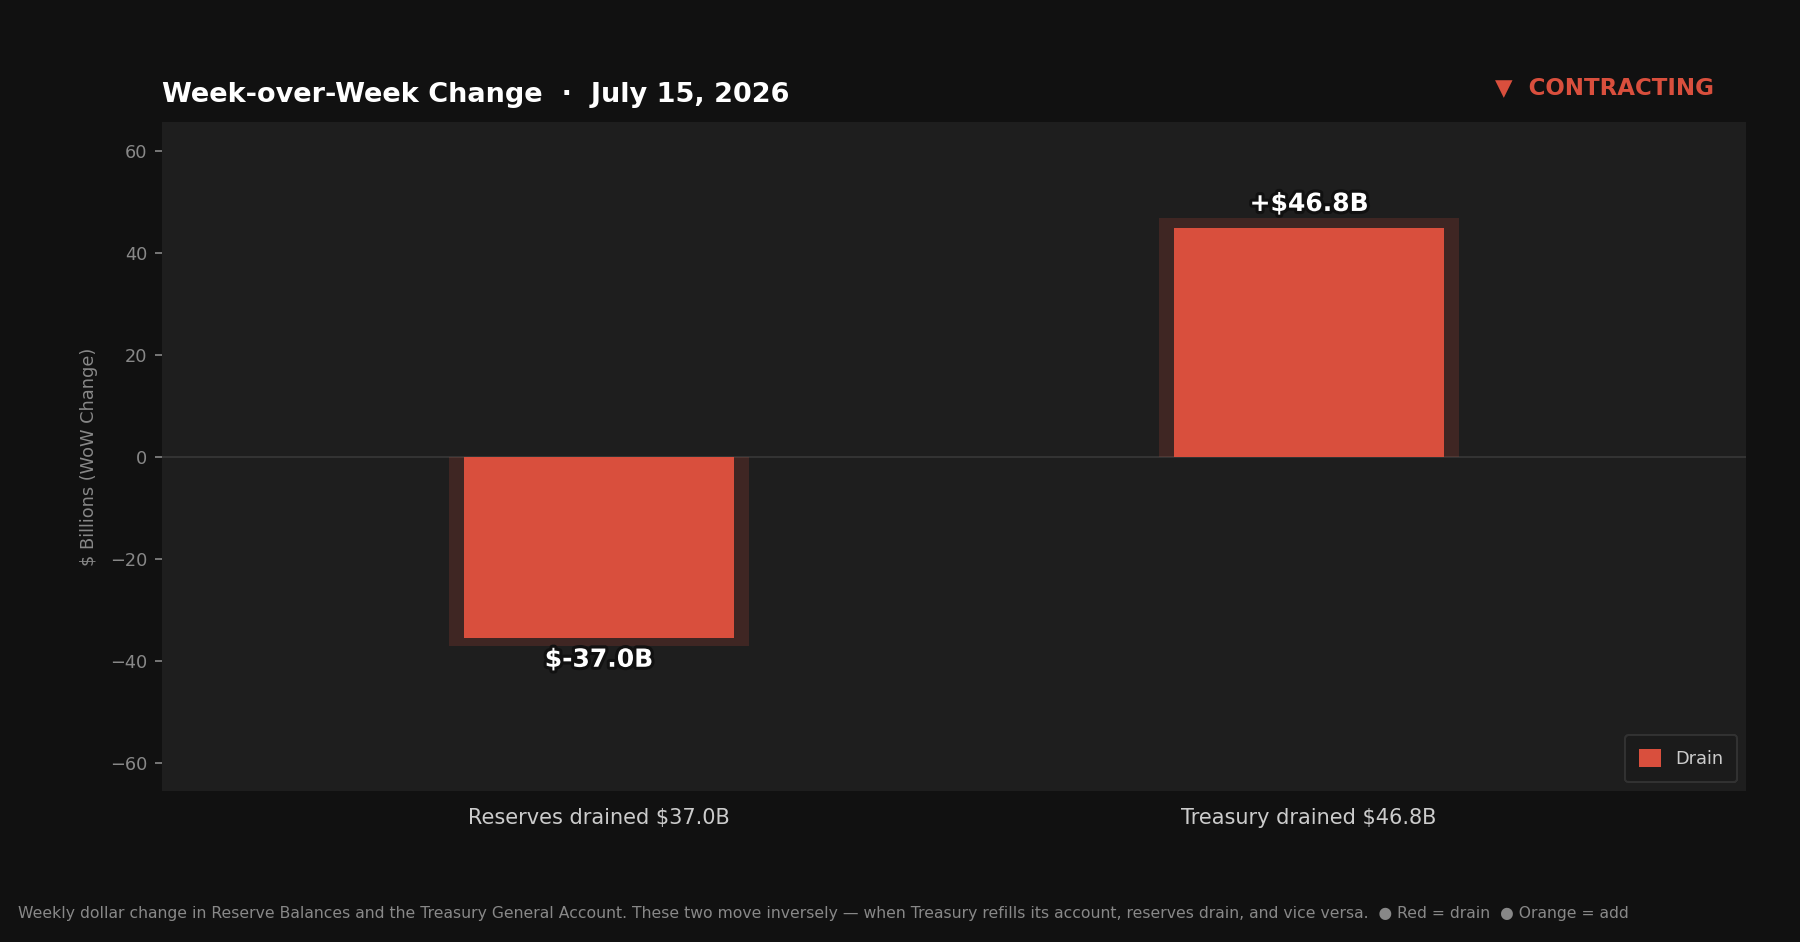
Three expanding signals in a row. Then this week: both the TGA refilled and the RRP rose again, draining reserves in the same direction simultaneously. No offsetting force. Reserves fell $37.0 billion. Signal: Contracting.
The streak breaking matters less than what broke it. The TGA is at $796 billion — still $400 billion above historical norms. The RRP answered the question raised in Issue #21: that wasn’t post-holiday noise. It’s the second consecutive week of increases. Both variables have shifted, and they shifted together.
Quick Update — Week ending July 15, 2026
Four rows from Table 1, Wednesday column:
Reserve balances with Federal Reserve Banks: $3,100.4B (~$3.10T) — down $37.0B from last week
U.S. Treasury General Account (TGA): $796.0B — up $46.7B from last week
Reverse repurchase agreements (RRP): $354.1B — up $5.6B from last week
Central bank liquidity swaps: $0.1B — near zero, no signal
Liquidity Signal — Week ending July 15, 2026
Direction: Contracting
Primary Driver: TGA refilled $46.7B — Treasury rebuilt its account as new auction proceeds offset spending, reversing the three-week drawdown trend
Implication: Reserves fell $37.0B. Both the TGA increase and a second consecutive RRP rise drained reserves in the same direction — double-barreled contraction with no offsetting force
4-Week Trend: Expanding / Expanding / Expanding / Contracting — first contraction after three consecutive expanding signals; TGA refill reversed direction; RRP confirmed as structural, not holiday noise
What Actually Happened
Last week the TGA sat at $749.2 billion — down $207 billion from its June record high over four weeks. This week it rose $46.7 billion to $796.0 billion. Treasury issued new debt, collected auction proceeds, and the account rebuilt. The sequence is standard: drawdown as spending flows out, refill as auction proceeds flow in, drawdown again as spending resumes.
From the reserve perspective, the TGA increase worked straightforwardly. When Treasury’s account at the Fed rises, that money leaves the banking system. $46.7 billion in, reserves out.
The RRP added pressure in the same direction. Two consecutive weeks of increases, landing at $354.1 billion. In Issue #21, the $10.1 billion holiday-week spike raised a specific question: repositioning noise or structural shift? A single week was inconclusive. Two weeks answers it. The RRP is now $15.7 billion higher than it was four weeks ago — rising through conditions that, two months ago, were pushing it lower.
The double-barreled nature of this week’s contraction is the standout feature. The three expanding issues all shared the same structure: TGA falling, partial absorption by the RRP, net reserves higher anyway. This week both variables moved against reserves at once. The TGA refilled. The RRP rose. No offsetting force. The result: reserves fell $37.0 billion with nothing cushioning the move.
The Mechanics, Briefly
Reserve balances are the banking system’s collective account at the Fed. When reserves rise, the system has more capacity to lend and invest. When they fall, that capacity tightens.
The TGA is Treasury’s checking account at the Fed. Auction proceeds and tax receipts flow in; government spending flows out. TGA up means reserves down. TGA down means reserves up.
The RRP is where money market funds park cash overnight at the Fed. Dollars sitting there aren’t circulating in the banking system. RRP rising is a reserve drain. RRP falling is a reserve injection.
This week: TGA up $46.7B (drain), RRP up $5.6B (drain), no offset. Reserves fell $37.0B.
The Streak Ends Here
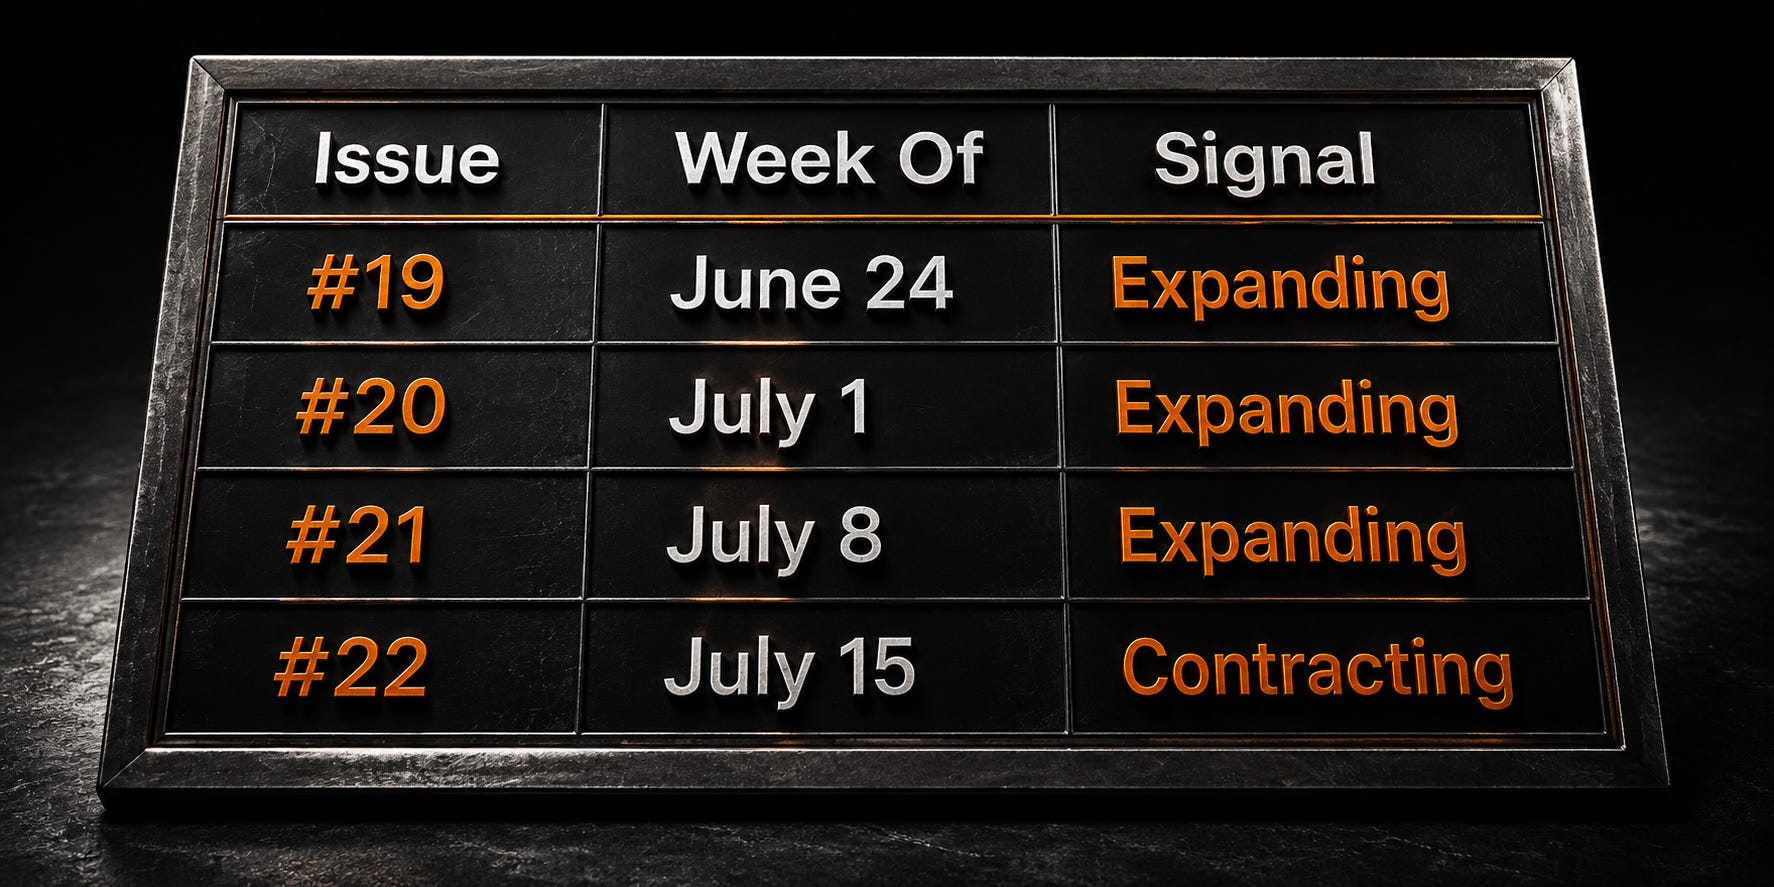
Three consecutive expanding signals was a meaningful run. The source — a TGA drawdown from record levels — was clear, consistent, and large. $207 billion returned to the banking system over four weeks.
This week $46.7 billion of that returned to the TGA. The net drawdown from the $956.5 billion record high is now $160.5 billion.
The TGA is still at $796 billion. Long-run normal sits around $300–400 billion. There’s still roughly $400 billion of potential reserve injection sitting in that account, and the sequence of auctions, spending decisions, and debt ceiling mechanics will determine how it returns. The three-week expanding trend isn’t reversed. It’s interrupted.
Structural Context: The Ratio
The Claims on Reserves Ratio tracks how many dollars of demandable banking-system claims exist per dollar of reserve buffer. When reserves fall without a commensurate decline in deposits, the ratio rises — the system gets incrementally more stretched relative to its cushion.
This week: 6.3×. Last week: 6.2×. Reserves fell $37.0 billion while deposits held approximately flat. The ratio stepped higher.
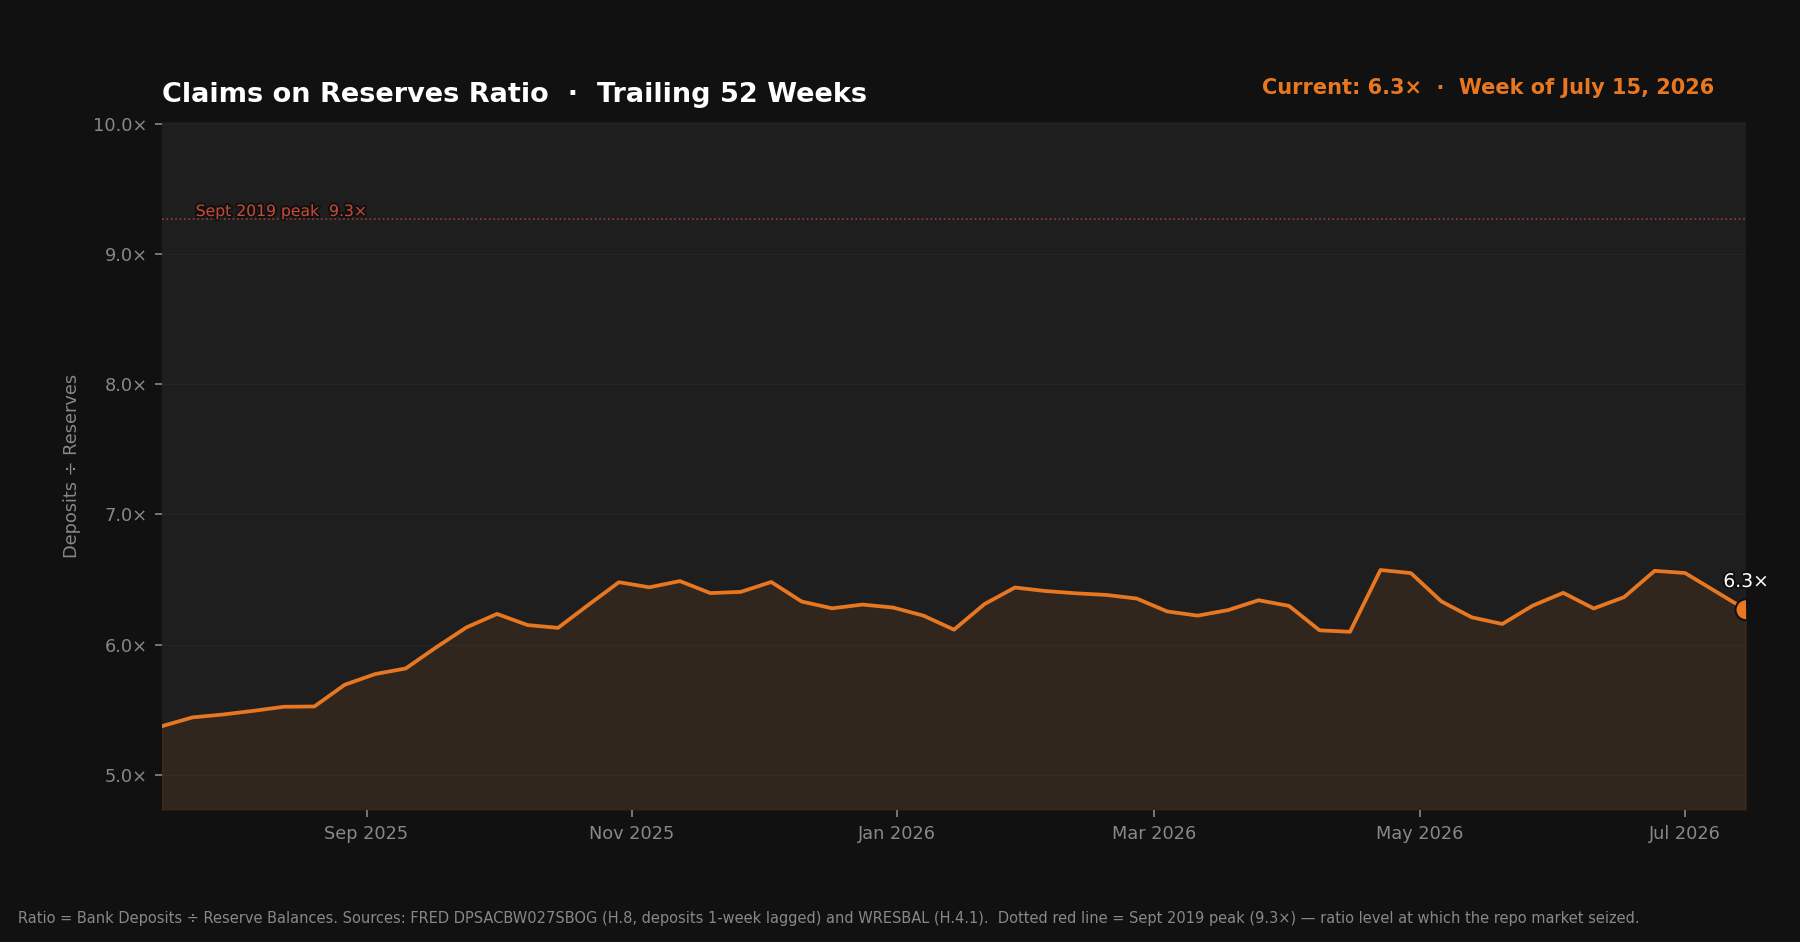
The September 2019 reference level — the ratio at which the repo market seized — sits at roughly 10×. At 6.3×, there’s significant distance from that threshold. The direction over the past several weeks has been consistently upward, though. Each week reserves fall without deposits declining alongside, the ratio steps higher.
One context point worth holding: the Standing Repo Facility, introduced in 2021, gives primary dealers a mechanism to borrow reserves against Treasuries at a known rate. The same 6.3× today doesn’t carry the same fragility as 6.3× would have in 2017. The plumbing has improved. Whether the improvement is enough if stress becomes system-wide is a different question — one where the direction of travel still matters.
Deposit data from FRED DPSACBW027SBOG (H.8 release). Due to H.8’s Friday publication schedule, deposits in this issue reflect July 1 data — approximately two weeks behind the July 15 reserve figure.
What to Watch
The RRP is the key variable for next week, with a different question than last week. Two consecutive increases from $338B to $354B is a pattern, not noise. The question is now where the facility stabilizes. If RRP usage keeps climbing, money market funds are systematically reducing exposure to the broader money market — which means less of the TGA’s eventual drawdown will flow cleanly into reserves.
The TGA’s trajectory matters more than its current level. At $796 billion and $400 billion above historical norms, there’s a large reserve injection still embedded in that account. The timing — whether Treasury draws it down over weeks or months, and how auction proceeds offset spending along the way — is the dominant variable for liquidity conditions through the rest of the summer.
The Claims on Reserves Ratio has now risen two consecutive weeks. If the next two to three issues continue to show reserve declines without deposit softening, the ratio will keep stepping upward. Worth watching for directional changes, not current level.
The Bitcoin Lens
Three expanding weeks ended with one contracting week. The cause is clear — Treasury restocked and money market funds continued repositioning — not a policy shift or market stress event.
Zoom out and the week’s complexity simplifies. The TGA is at $796 billion. Historical norms are $300–400 billion. The system still has $400 billion of potential reserve injection sitting in a government account, waiting on spending decisions and auction schedules. Whether that flows back this week, next month, or across the fall depends on mechanics that are difficult to time precisely.
The structural direction hasn’t changed. The debt that gets issued to refill the TGA creates dollars. The spending that draws it down distributes dollars. The system has to keep issuing because the system has to keep paying. It’s simply how a fiat monetary system funded by debt operates at scale.
Bitcoin’s supply is fixed. The dollar supply is not. The long-run direction of Bitcoin’s price in dollars is the logical conclusion of that asymmetry. That’s the only call this series makes.