

H.4.1 Liquidity Watch // Issue #23
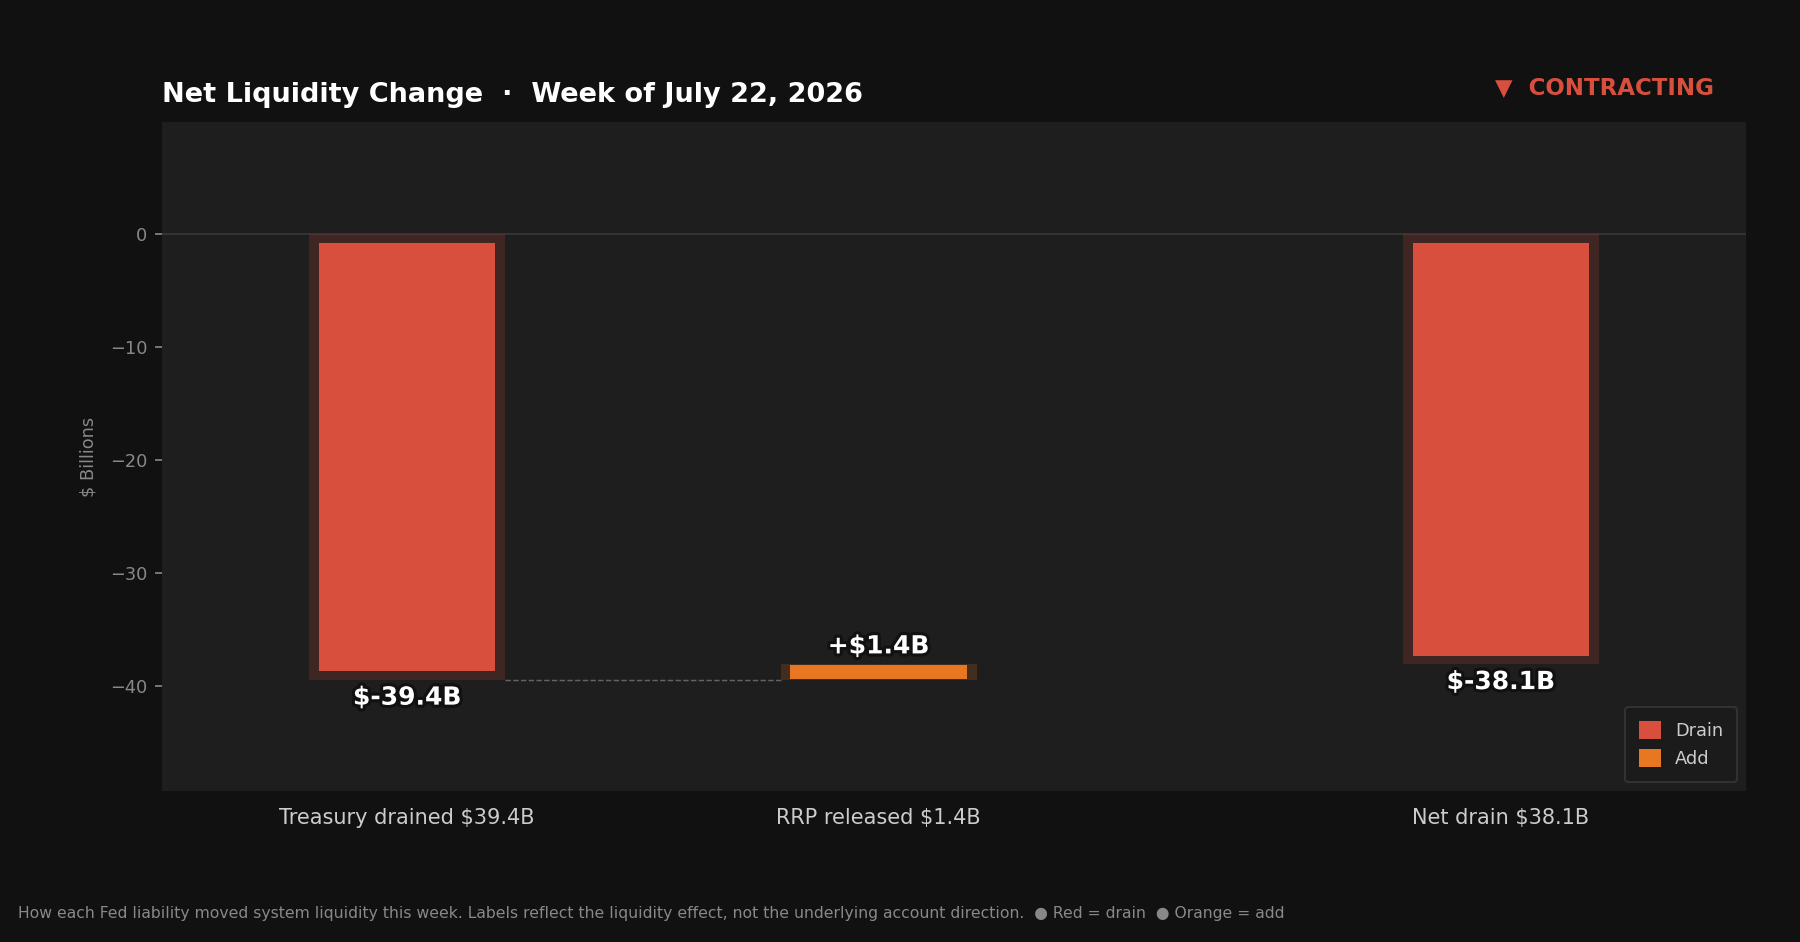
Second consecutive contraction. The TGA rose $39.4 billion; the RRP gave back $1.4 billion after two weeks of gains. Signal: Contracting.


The Weekly H.4.1 Breakdown
Issue #23 — July 23, 2026
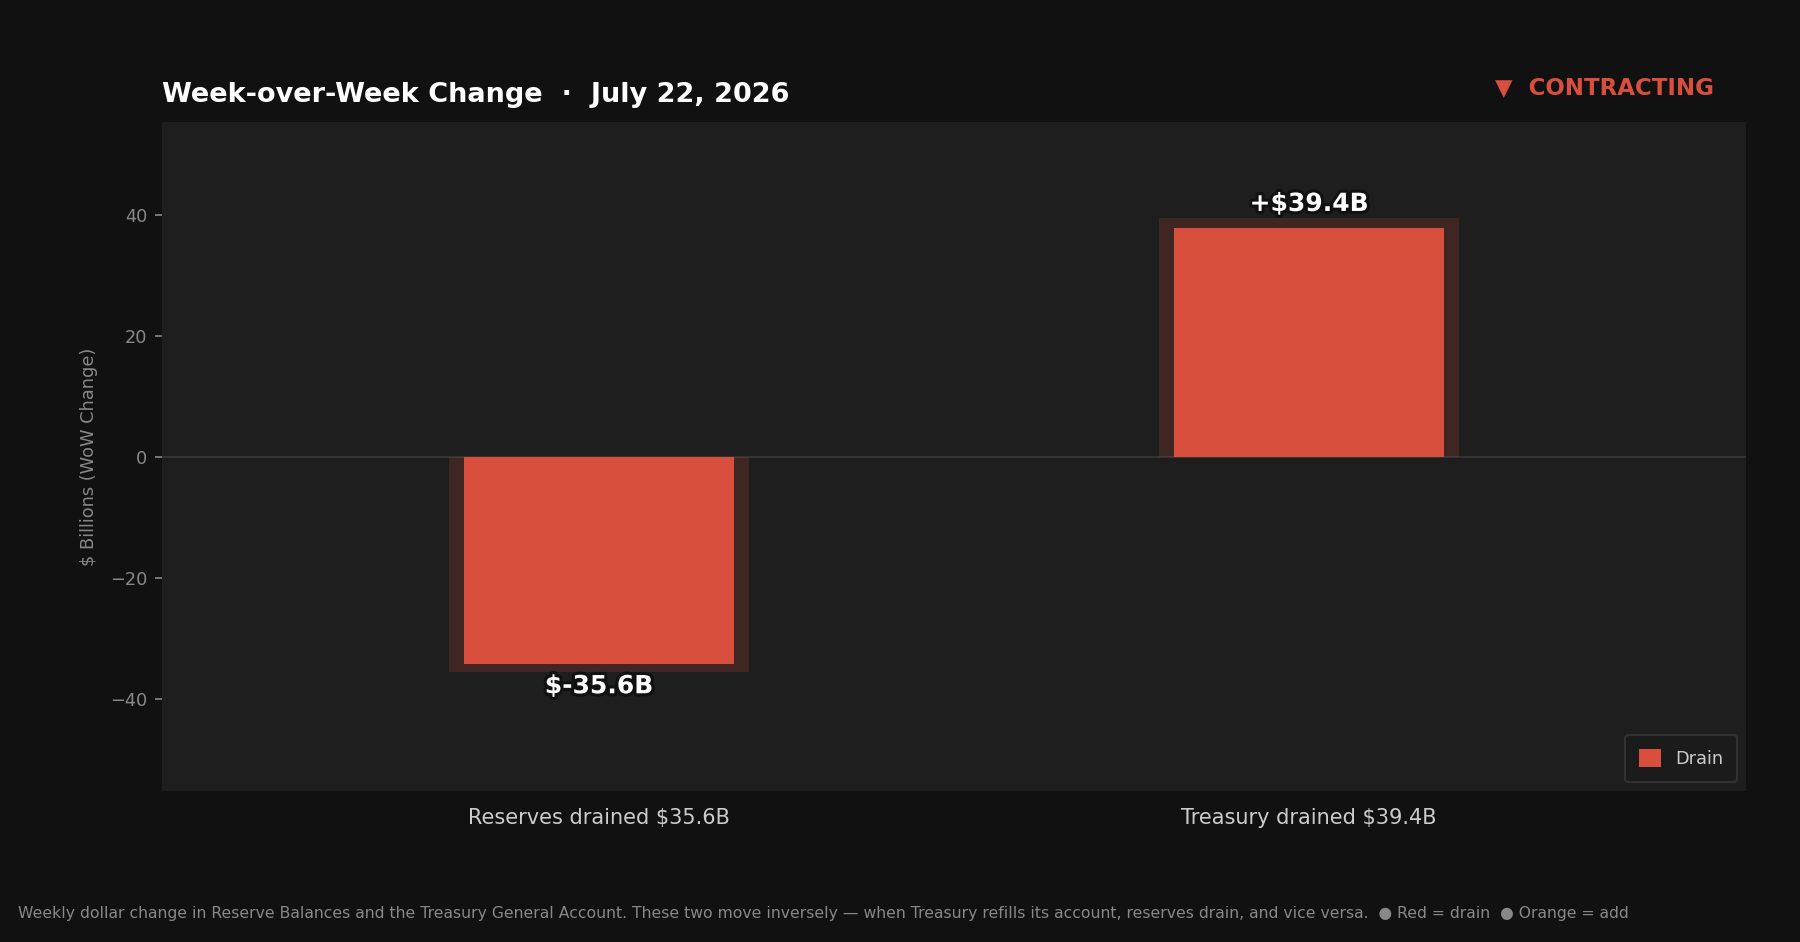
Second week, same direction, different cause. Last week both the TGA and the RRP moved against reserves at once. This week the RRP backed off slightly, but the TGA kept refilling on its own and pulled reserves down again. Reserves fell $35.6 billion. Signal: Contracting, for the second week running.
The interesting part isn’t that reserves fell again — it’s that the mechanism changed. Last week was described here as “double-barreled,” both drains open together. This week one drain did almost all the work alone.
Quick Update — Week ending July 22, 2026
Four rows from Table 1, Wednesday column:
Reserve balances with Federal Reserve Banks: $3,064.9B (~$3.065T) — down $35.6B from last week
U.S. Treasury General Account (TGA): $835.4B — up $39.4B from last week
Reverse repurchase agreements (RRP): $352.7B — down $1.4B from last week
Central bank liquidity swaps: $0.4B — near zero, no signal
Liquidity Signal — Week ending July 22, 2026
Direction: Contracting
Primary Driver: TGA refilled another $39.4B — Treasury’s account continued rebuilding for a second straight week
Implication: Reserves fell $35.6B. Unlike last week, the RRP eased $1.4B instead of adding to the drain — the TGA is now doing nearly all the work by itself
4-Week Trend: Expanding / Expanding / Contracting / Contracting — second consecutive contracting signal; TGA remains the dominant driver both weeks; RRP no longer confirms the drain
What Actually Happened
Last week the TGA rose $46.7 billion to $796.0 billion, ending a three-week expanding streak. This week it rose again, $39.4 billion more, landing at $835.4 billion. Treasury’s account at the Fed has now refilled for two consecutive weeks, and each dollar that flows in leaves the banking system on the other side. $39.4 billion in, reserves out.
The RRP told a different story than last week. Two straight weeks of increases had pushed it to $354.1 billion and closed the question of whether the earlier spike was holiday noise. This week it gave a little back, falling $1.4 billion to $352.7 billion. One week isn’t enough to call it a reversal — it could be the top of that two-week climb, or it could be a pause before the facility keeps rising. Either way, it stopped adding to the contraction.
That’s the difference from Issue #22. Both weeks show reserves falling. Last week, two variables moved against reserves at the same time with nothing cushioning it. This week, the TGA is carrying the contraction essentially alone, with the RRP a minor and slightly offsetting factor rather than a second drain. Reserves still fell $35.6 billion — a smaller move than last week’s $37.0 billion, and one variable explains most of it.
The Mechanics, Briefly
Reserve balances sit in the banking system’s collective account at the Fed. More reserves, more lending and investing capacity. Fewer reserves, less of both.
The TGA is Treasury’s checking account at the Fed. Money flows in from auctions and tax receipts, out through government spending. When the account grows, reserves shrink by roughly the same amount, and vice versa.
The RRP holds cash that money market funds park overnight at the Fed instead of lending it into the banking system. A rising RRP drains reserves; a falling one returns them.
This week: TGA up $39.4B (drain), RRP down $1.4B (small injection). Net effect: reserves down $35.6B, with the TGA doing nearly all of the work.
Same Direction, Different Driver
Four-week signal history:
IssueWeek OfSignal#20July 1Expanding#21July 8Expanding#22July 15Contracting#23July 22Contracting
Two contracting weeks now, but they don’t look alike underneath. Issue #22 was the TGA and the RRP moving together — a coordinated drain. This issue is the TGA moving alone, with the RRP no longer confirming the direction. If that holds, the RRP is a wobblier signal than the TGA has been across this series, and the TGA’s trajectory is still the variable worth tracking.
The TGA has now recovered $86.1 billion of the $207 billion it drew down over four weeks in June. It sits at $835.4 billion — still roughly $435–535 billion above the $300–400 billion range this series treats as historical norm. Most of that eventual drain still hasn’t happened.
Structural Context: The Ratio
The Claims on Reserves Ratio tracks how many dollars of demandable banking-system claims exist per dollar of reserve buffer. When reserves fall without a commensurate decline in deposits, the ratio rises.
This week: 6.3×. Last week: 6.3×. The rounded number held, but the underlying figure ticked up again — from roughly 6.27 to 6.32 — which keeps the multi-week drift intact even though the headline didn’t move.
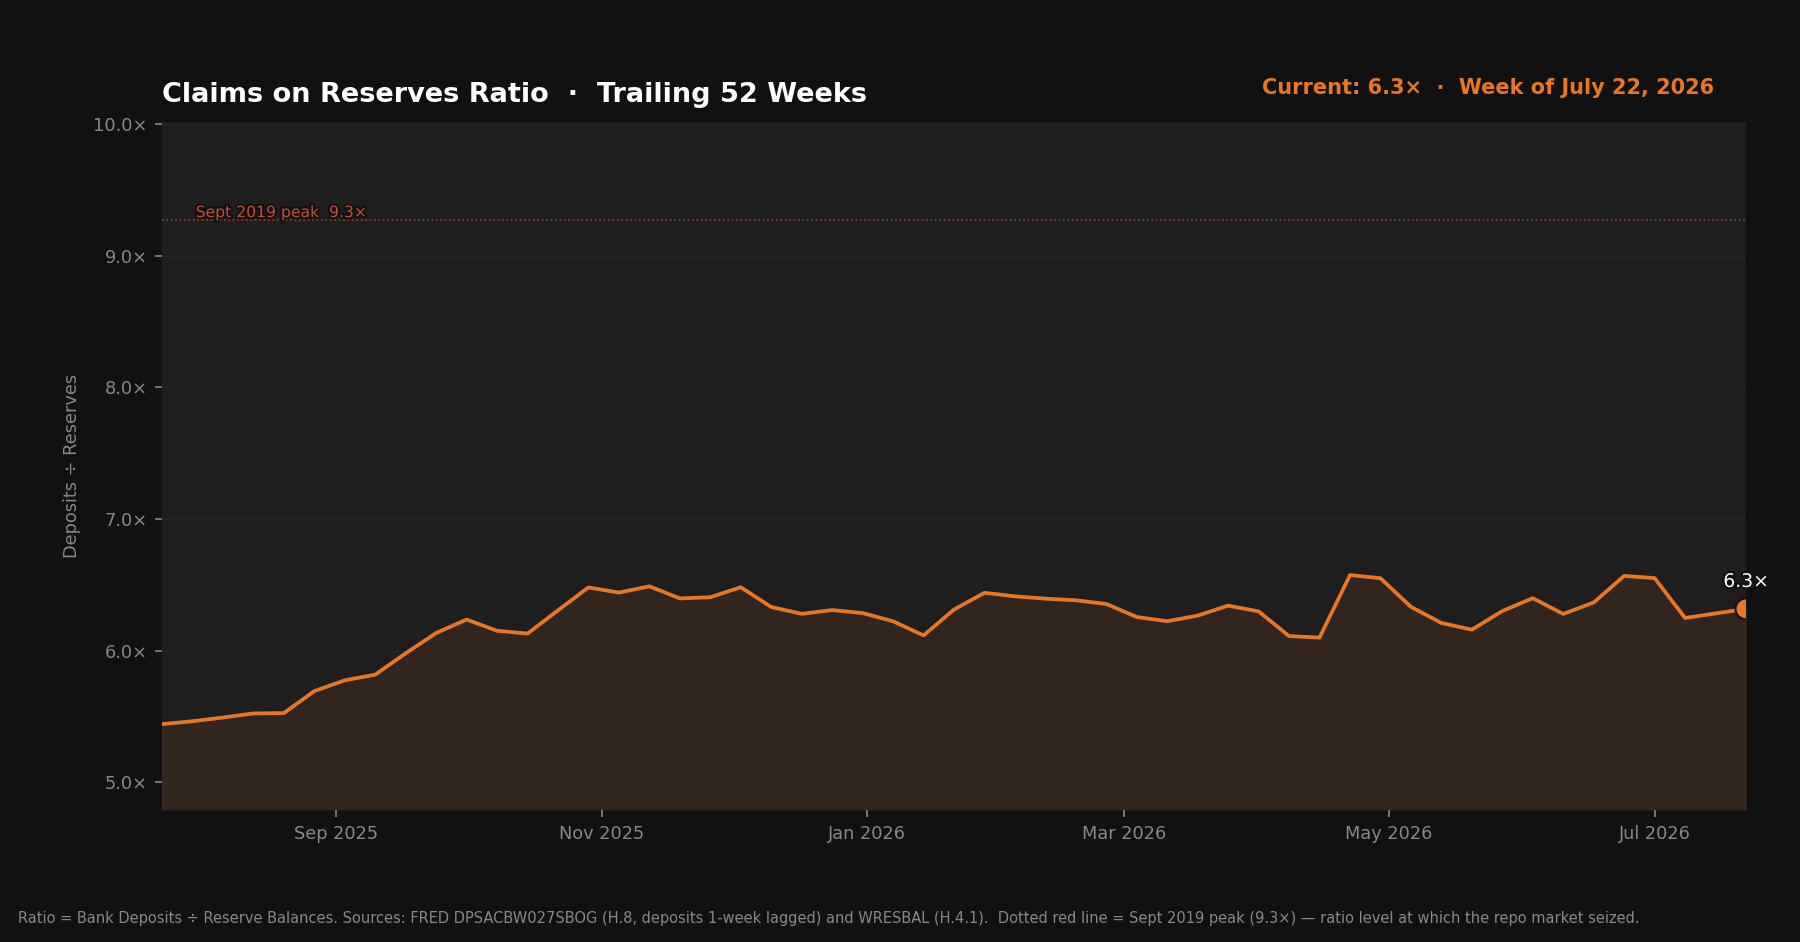
The September 2019 reference level sits at roughly 10×. At 6.3×, there’s still meaningful distance from that threshold, and the ratio isn’t accelerating — it’s creeping. Worth remembering: the Standing Repo Facility introduced in 2021 gives primary dealers a way to borrow reserves against Treasuries at a known rate, so 6.3× today doesn’t carry identical fragility to 6.3× before that facility existed. Whether that cushion is enough if stress ever becomes system-wide is a separate question from whether the ratio itself keeps climbing.
Deposit data from FRED DPSACBW027SBOG (H.8 release). Due to H.8’s Friday publication schedule, deposits in this issue reflect July 8 data — roughly two weeks behind the July 22 reserve figure.
What to Watch
The TGA is still the dominant variable. At $835.4 billion, it’s climbed for two straight weeks and remains far above the $300–400 billion range this series treats as normal. Whether Treasury keeps rebuilding it at this pace, slows down, or starts drawing it back down depends on auction schedules and spending decisions that aren’t visible in this report alone.
The RRP’s single-week dip is the open question. Was the two-week climb topping out, or was this a pause inside a longer uptrend? One data point can’t answer that — next week’s move will tell us more than this week’s did.
The ratio ticked up again beneath a flat headline number. If reserves keep falling faster than deposits do, expect the displayed ratio to cross into 6.4× territory before long, even if it doesn’t feel like a big move week to week.
The Bitcoin Lens
Two weeks of contraction now, but for different reasons. Last week both the fiscal and technical drains opened together. This week the TGA is doing the work alone while the RRP takes a step back. Neither is a policy shift or a stress event — just the ordinary mechanics of a government account rebuilding after a drawdown.
Zoom out and the specifics stop mattering as much. The TGA is $835.4 billion against a $300–400 billion historical norm. Somewhere between $435 billion and $535 billion of potential reserve injection is still sitting in that account, waiting on spending and auction timing that’s difficult to call in advance.
The system needs dollars to keep functioning, and the debt that gets issued to fund it creates those dollars whether this week’s signal says expanding or contracting. That’s the mechanism this series exists to track — not the week-to-week noise, but the direction underneath it.
Bitcoin’s supply doesn’t move with any of this. The dollar’s does. The long-run direction of the dollars is the long-run direction of Bitcoin’s price.
Source: Federal Reserve H.4.1 release, July 23, 2026. Claims on Reserves Ratio uses deposits from FRED DPSACBW027SBOG (H.8 release) and reserve balances from FRED WRESBAL (H.4.1).