

H.4.1 Liquidity Watch // Issue #24
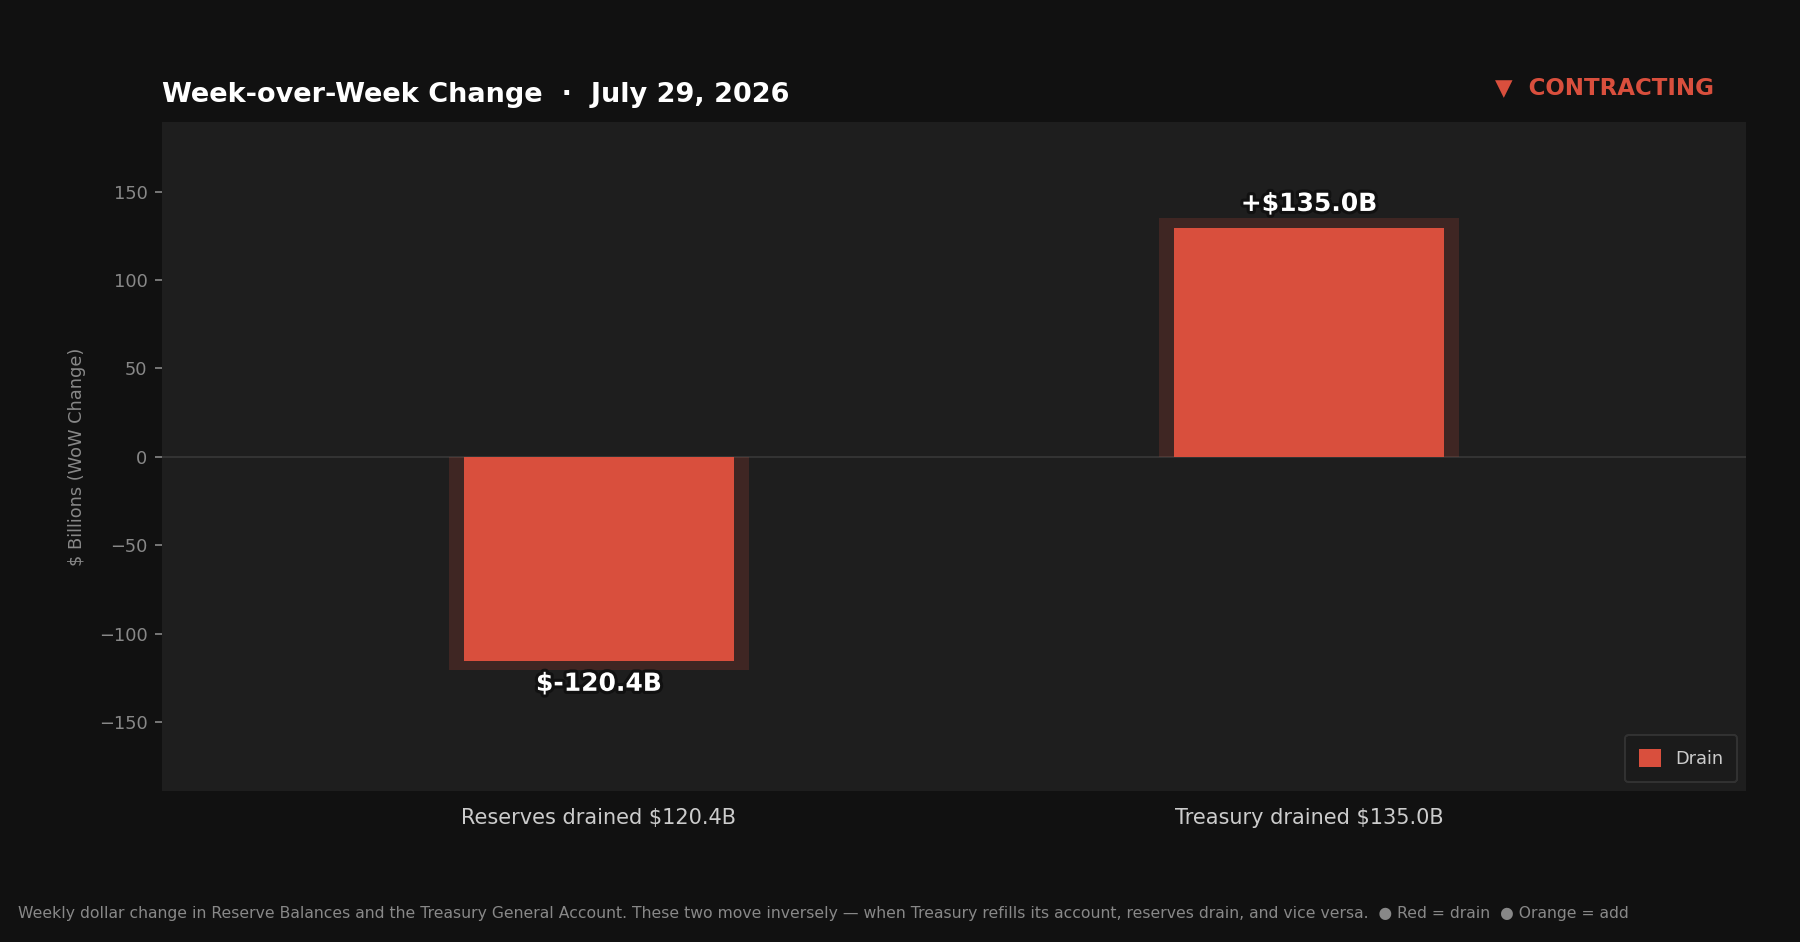
The TGA surged $135 billion to $970.4 billion, its highest level since April, pulling reserves down $120.4 billion in the sharpest move in weeks. Third consecutive contracting signal.


The Weekly H.4.1 Breakdown
Issue #24 — July 30, 2026
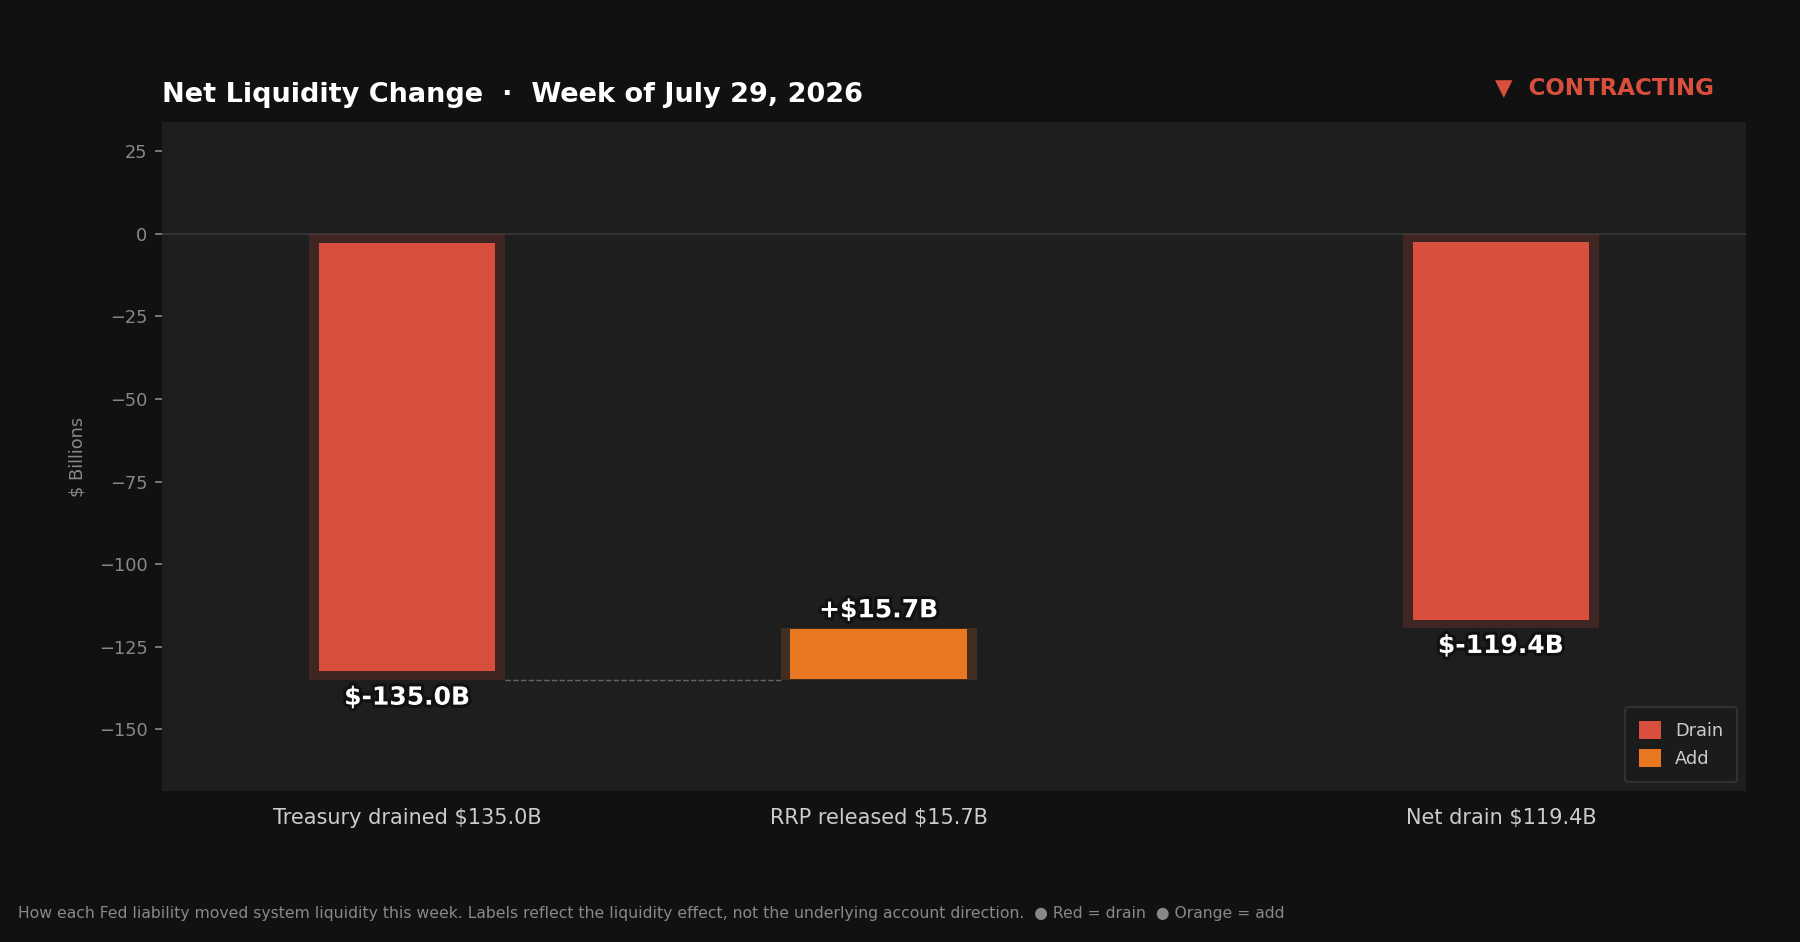
Third contracting week in a row, and this one isn’t subtle. The TGA didn’t just refill again — it surged $135.0 billion in a single week, pushing the account to its highest level since April. Reserves fell $120.4 billion, one of the sharpest single-week drops this series has tracked. Signal: Contracting.
The pace is the story here. The last two weeks saw the TGA add $46.7 billion, then $39.4 billion. This week added more than both of those combined.
Quick Update — Week ending July 29, 2026
Four rows from Table 1, Wednesday column:
Reserve balances with Federal Reserve Banks: $2,944.5B (~$2.945T) — down $120.4B from last week
U.S. Treasury General Account (TGA): $970.4B — up $135.0B from last week
Reverse repurchase agreements (RRP): $337.1B — down $15.7B from last week
Central bank liquidity swaps: $0.1B — near zero, no signal
Liquidity Signal — Week ending July 29, 2026
Direction: Contracting
Primary Driver: TGA surged $135.0B — the largest weekly increase since Issue #18’s $155.4B move — pushing the account to $970.4B, its highest level since April and above the $956.5B mid-June high, though still $36.8B short of this series’ true peak of $1.007 trillion
Implication: Reserves fell $120.4B, among the largest single-week declines this series has tracked. RRP eased another $15.7B, extending last week’s reversal rather than confirming a floor
4-Week Trend: Expanding / Contracting / Contracting / Contracting — third consecutive contracting signal; the TGA’s pace, not just its direction, is what changed this week
What Actually Happened
The TGA has refilled for three consecutive weeks now — $46.7 billion, then $39.4 billion, then this week’s $135.0 billion. That’s not a continuation of the same trend, it’s an acceleration. Treasury’s account at the Fed jumped from $835.4 billion to $970.4 billion in seven days, and every dollar that flowed in came out of the banking system on the other side.
The level matters as much as the move, and it’s worth correcting something here. Past issues in this series referenced $956.5 billion, reached in mid-June, as the TGA’s record high. It wasn’t. The actual peak came earlier — $1.007 trillion, reached the week of Issue #10 back in April, during that year’s tax season, and reported in this series at the time. This week’s $970.4 billion clears the June level by $13.9 billion, but it’s still $36.8 billion below the April peak. The TGA is rebuilding toward its old highs. It hasn’t gotten there yet.
The RRP added to the pressure rather than offsetting it. After two weeks of increases that closed out the “holiday noise” question from earlier issues, it’s now fallen for a second straight week, down $15.7 billion to $337.1 billion. Combined with last week’s smaller decline, the RRP has given back $17.1 billion since its recent peak — which raises a new question to replace the old one: was the two-week rise the anomaly, or is this the anomaly?
Reserves absorbed both moves and fell $120.4 billion, a decline more in line with Issue #18’s $175.1 billion drop than the smaller moves of the past two issues.
The Mechanics, Briefly
Reserve balances sit in the banking system’s collective account at the Fed. More reserves, more lending and investing capacity. Fewer reserves, less of both.
The TGA is Treasury’s checking account at the Fed. Money flows in from auctions and tax receipts, out through government spending. When the account grows, reserves shrink by roughly the same amount, and vice versa.
The RRP holds cash that money market funds park overnight at the Fed instead of lending it into the banking system. A rising RRP drains reserves; a falling one returns them.
This week: TGA up $135.0B (drain), RRP down $15.7B (injection). Net effect: reserves down $120.4B, with the TGA’s surge overwhelming the RRP’s partial offset.
The Highest Since April — Not a Record
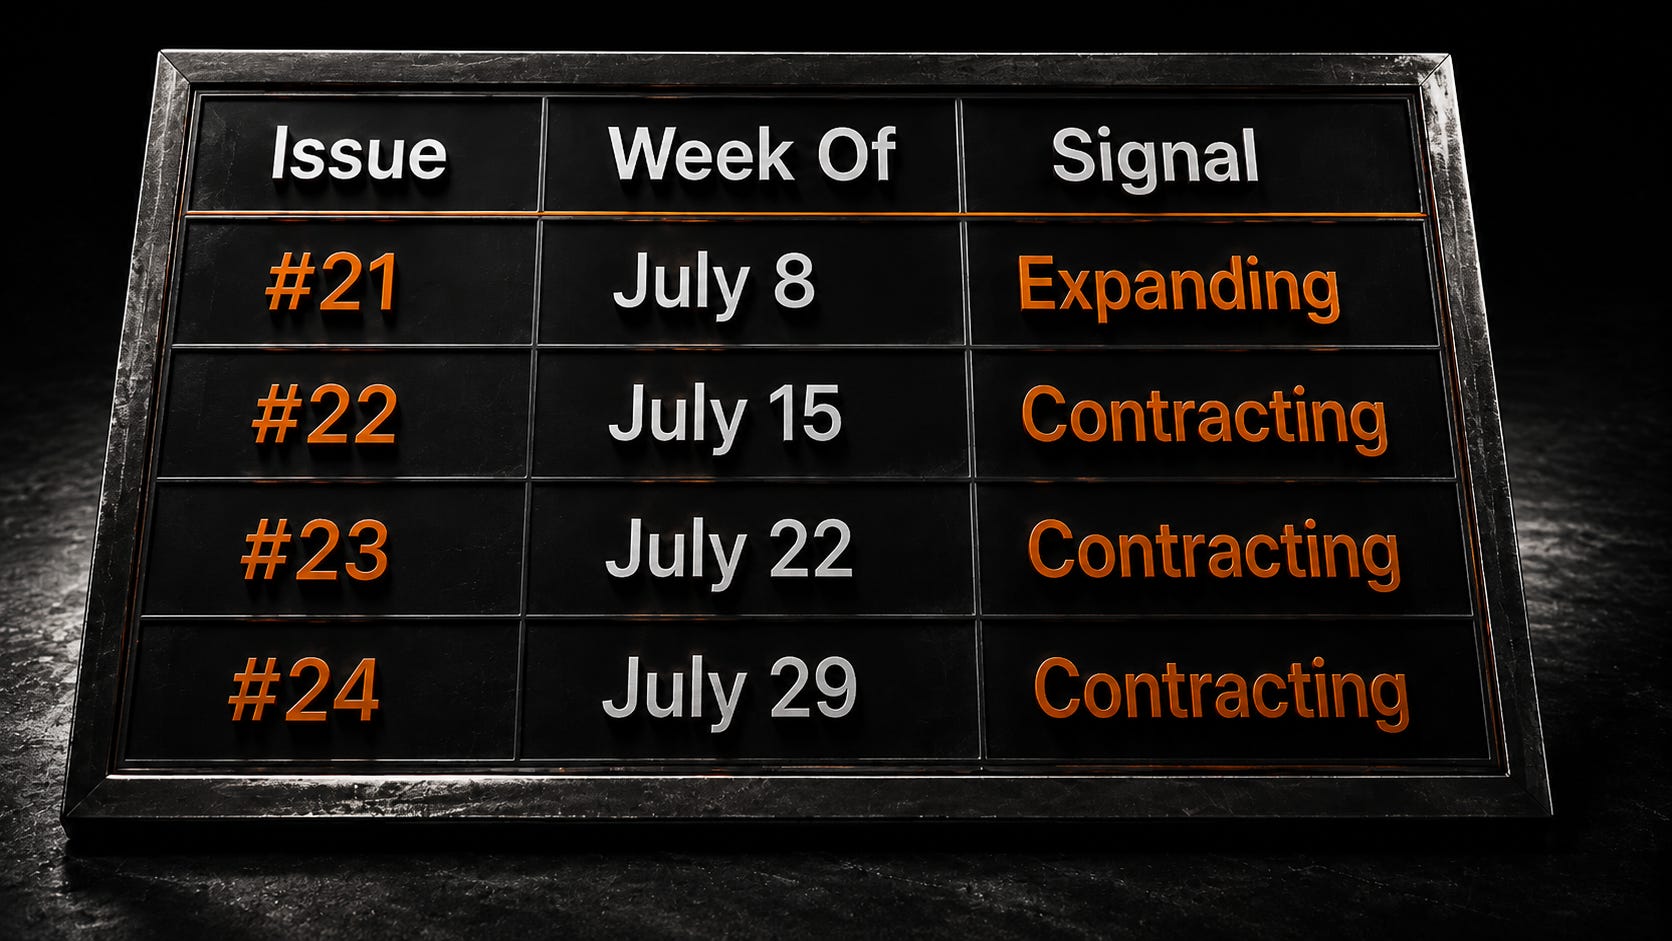
Three contracting weeks running now, and each has looked different underneath. Issue #22 was TGA and RRP moving together. Issue #23 was the TGA alone, at a moderate pace. This issue is the TGA alone again, but at close to triple the pace of either prior week — enough to put the account at a level it hasn’t touched since April.
That three-month framing matters more than it sounds like it should. A $956.5 billion peak reached in mid-June is now $13.9 billion behind this week’s balance — but this series’ actual high-water mark is April’s $1.007 trillion, still $36.8 billion above where the account sits today. Whatever combination of auction proceeds and spending timing produced this week’s number, it did more in seven days than the prior two weeks did combined. It just didn’t set a new record.
Structural Context: The Ratio
The Claims on Reserves Ratio tracks how many dollars of demandable banking-system claims exist per dollar of reserve buffer. When reserves fall without a commensurate decline in deposits, the ratio rises — and this week it didn’t just creep, it jumped.
This week: 6.6×. Last week: 6.3×. Reserves fell $120.4 billion while deposits rose slightly, and the combination pushed the ratio up by roughly three-tenths in a single week — the largest move this series has recorded for this metric, compared to the gradual 6.2× → 6.3× drift of the past several issues.
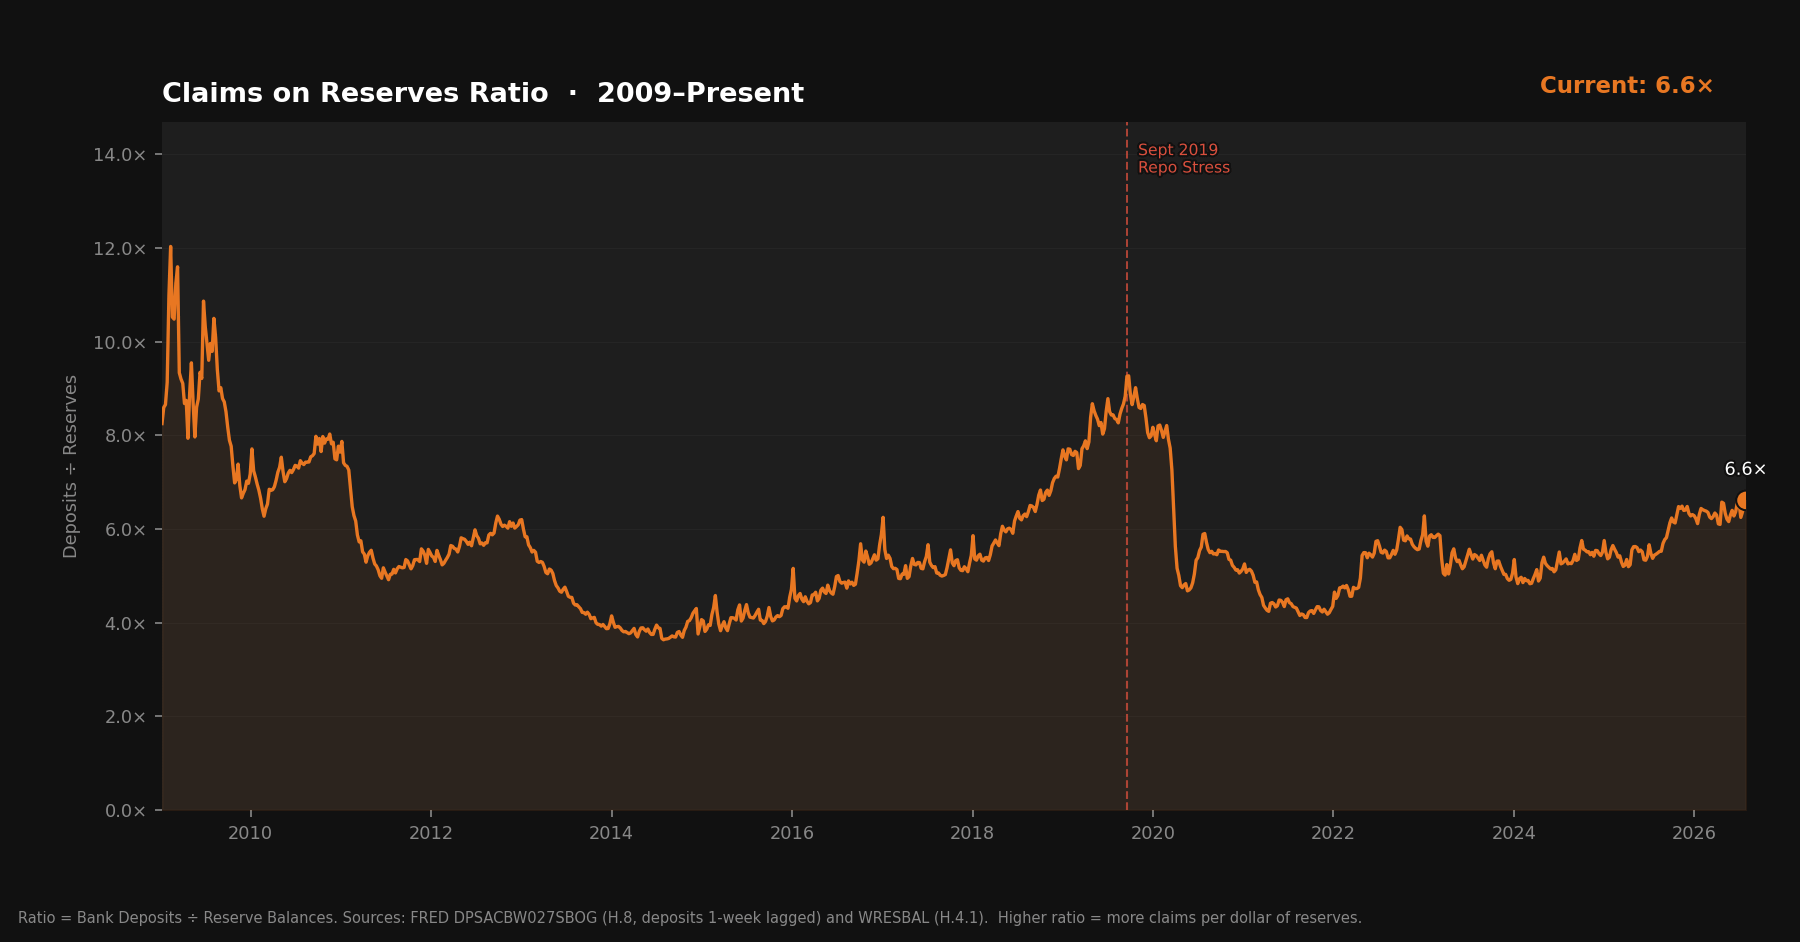
The September 2019 reference level sits at roughly 10×. At 6.6×, there’s still real distance from that threshold, but the gap closed faster this week than in any prior issue. One data point doesn’t confirm a new pace of climb — reserves could just as easily recover next week if the TGA pauses or the RRP stabilizes — but a jump this size after weeks of gradual drift is exactly the kind of move this section exists to flag. Worth remembering: the Standing Repo Facility introduced in 2021 gives primary dealers a way to borrow reserves against Treasuries at a known rate, so 6.6× today doesn’t carry identical fragility to 6.6× before that facility existed.
Deposit data from FRED DPSACBW027SBOG (H.8 release). Due to H.8’s Friday publication schedule, deposits in this issue reflect July 15 data — roughly two weeks behind the July 29 reserve figure.
What to Watch
The TGA’s pace is now the central question, not just its direction. Three weeks of refilling at accelerating speed, now at a three-month high with the true April peak still $36.8 billion above it, raises a question the last two issues didn’t need to ask: does Treasury keep building the account higher, or does this week mark a local peak followed by renewed drawdown? The next one or two issues should clarify which.
The RRP’s second consecutive decline needs a similar gut check. Two weeks of increases, framed as a possible structural shift in Issue #22, have now been followed by two weeks of decreases. That doesn’t necessarily undo the earlier read — it may mean the facility is simply more volatile in both directions than the four-week pattern before it suggested.
The ratio’s jump to 6.6× is the most concrete thing to watch. A single sharp move is meaningfully different from the slow drift of the past several issues, and whether it holds, extends, or partially reverses next week will say more about the trend than the number itself does right now.
The Bitcoin Lens
Three contracting weeks in a row, and this one put the TGA at a three-month high. The account is $135 billion heavier than it was seven days ago, above every level it’s touched since April’s tax-season peak, even if it hasn’t reached that peak itself. None of this is a policy shift or a stress event — it’s Treasury’s account doing what Treasury accounts do, just faster this week than in recent memory.
Zoom out and the mechanism hasn’t changed even though the pace has. The debt that gets issued to fund a $970 billion government checking account creates dollars somewhere in the process, whether those dollars are sitting in the TGA today or back in the banking system next month. The system needs the debt to keep flowing because the system needs the spending it funds to keep flowing.
Bitcoin’s supply doesn’t move with any of this, fast weeks or slow ones. Bitcoin doesn’t negotiate with the dollar. It just absorbs it.
Source: Federal Reserve H.4.1 release, July 30, 2026. Claims on Reserves Ratio uses deposits from FRED DPSACBW027SBOG (H.8 release) and reserve balances from FRED WRESBAL (H.4.1).