

H.4.1 Liquidity Watch // Issue #26


The Weekly H.4.1 Breakdown
Issue #26 — August 13, 2026
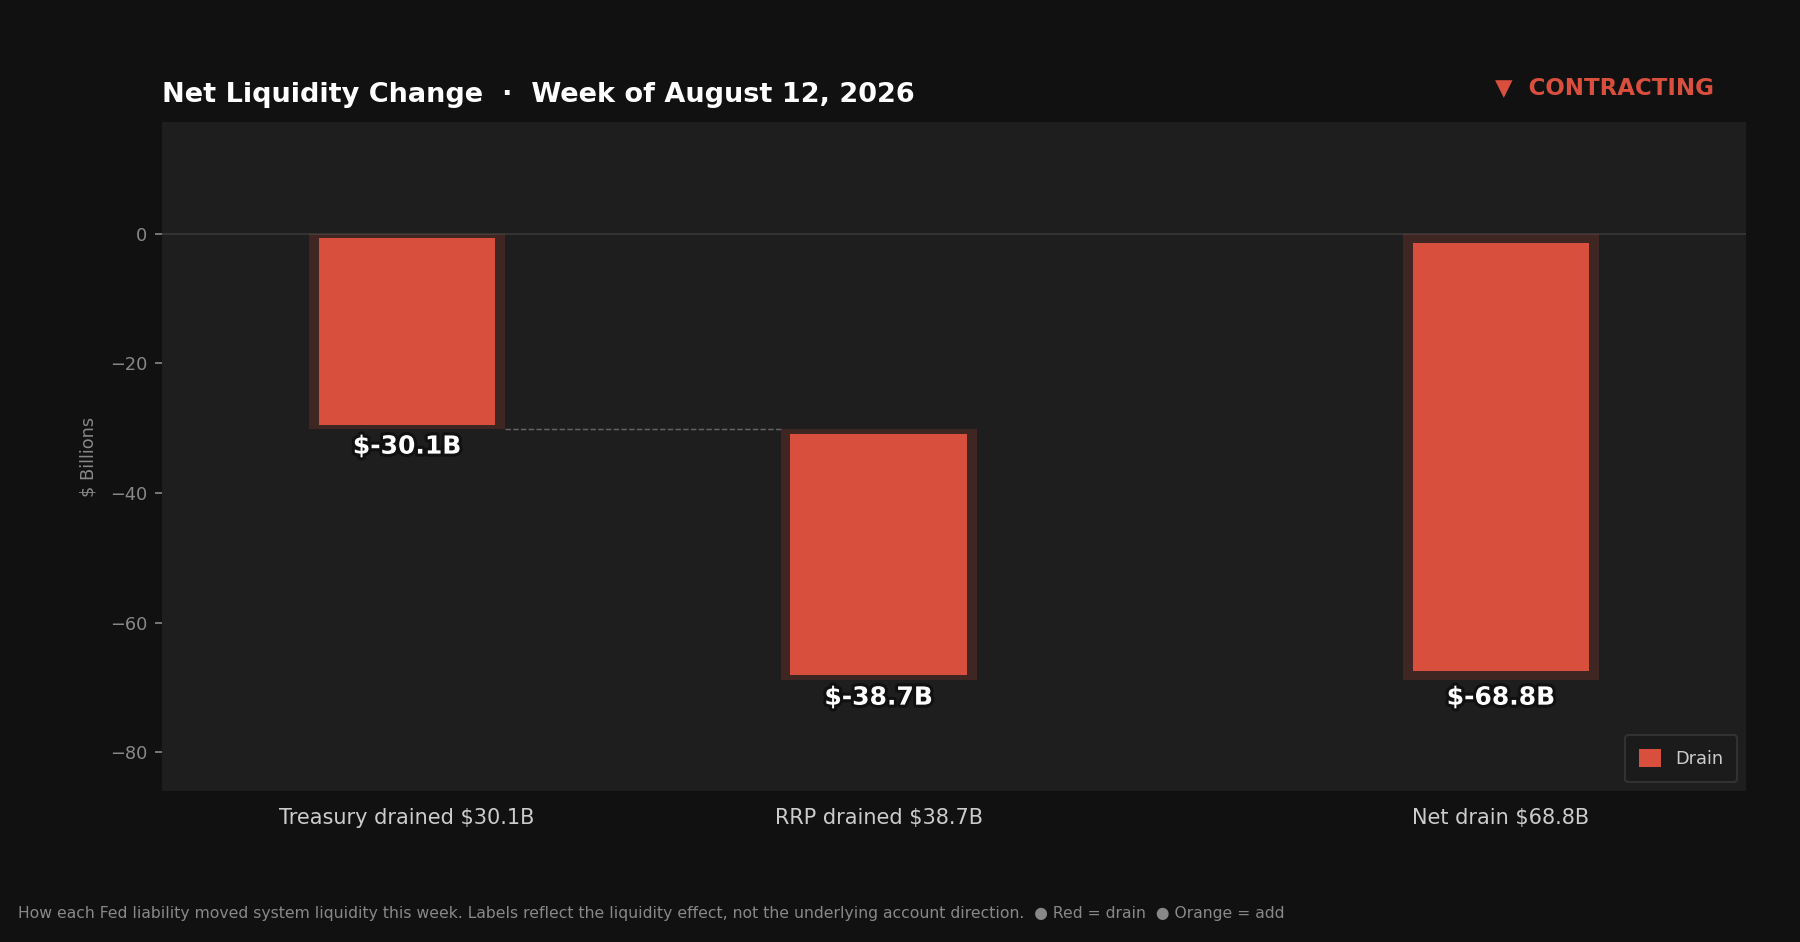
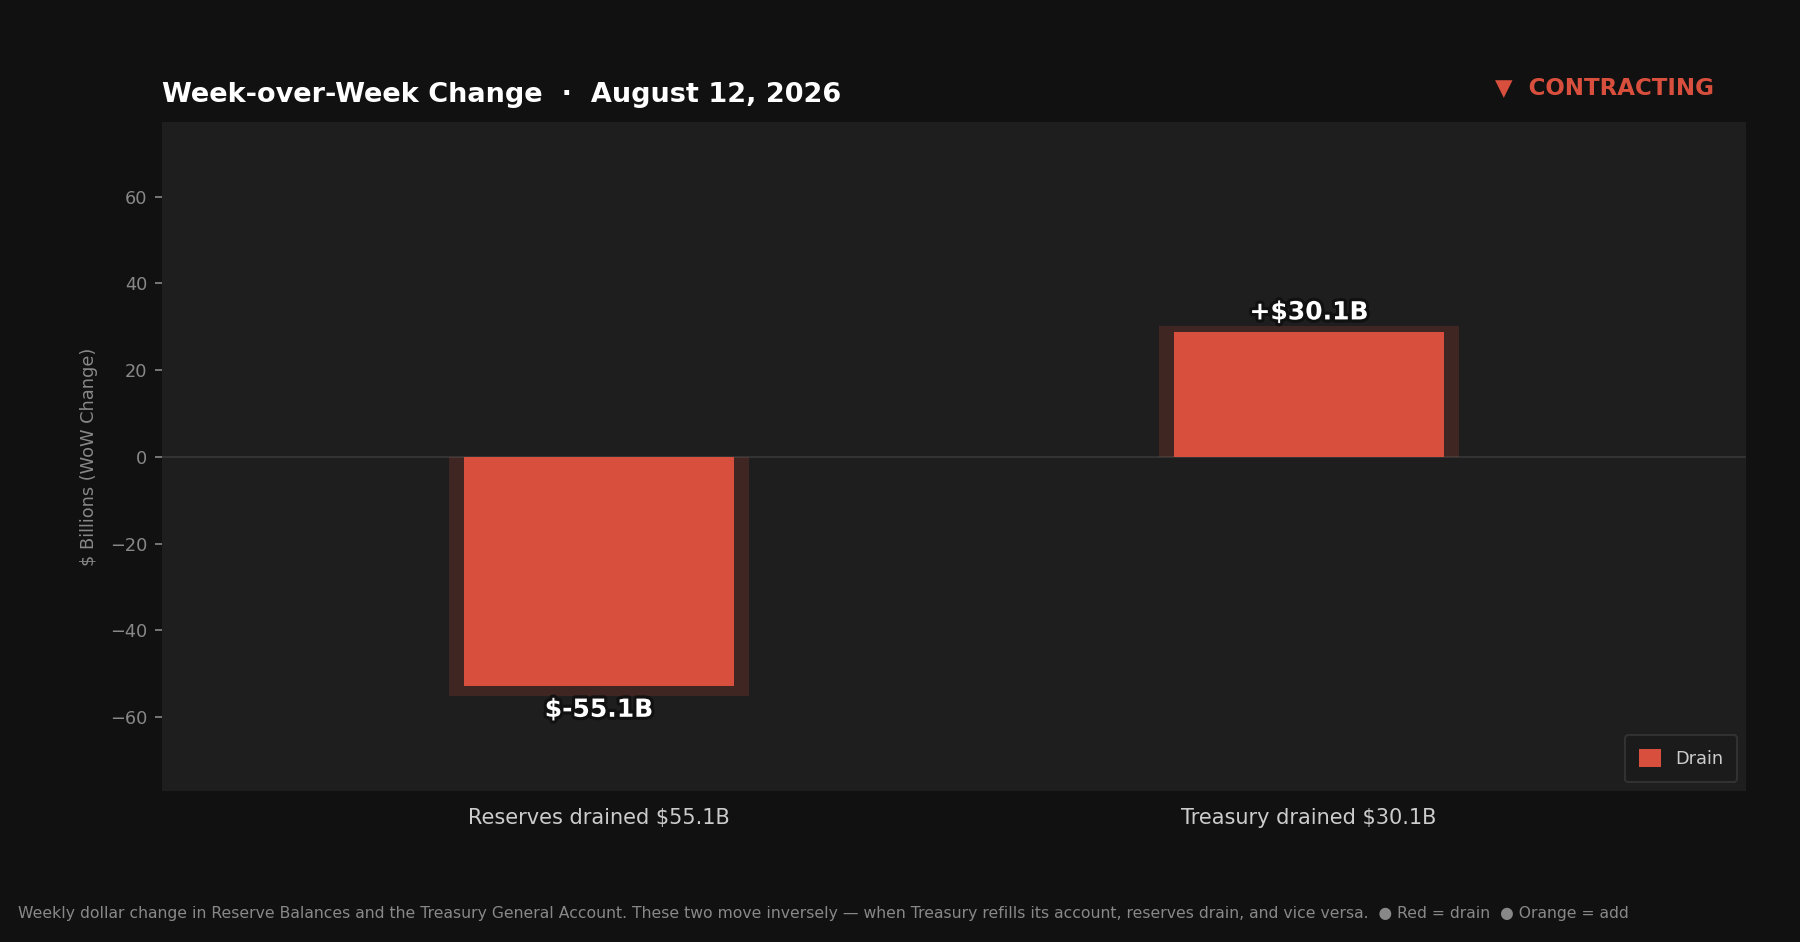
One expanding week, and both drains reopened. Last week’s story was a three-week RRP decline that looked like a real pattern. This week the RRP jumped $38.7 billion — more than erasing that decline in a single move — while the TGA added another $30.1 billion on top of it. Reserves fell $55.1 billion. Signal: Contracting.
Worth saying plainly: Issue #25 called the RRP’s three-week decline a pattern rather than noise. This week argues the other way. Both readings were reasonable given what each week knew at the time.
Quick Update — Week ending August 12, 2026
Four rows from Table 1, Wednesday column:
Reserve balances with Federal Reserve Banks: $2,947.6B (~$2.948T) — down $55.1B from last week
U.S. Treasury General Account (TGA): $959.4B — up $30.1B from last week
Reverse repurchase agreements (RRP): $358.1B — up $38.7B from last week
Central bank liquidity swaps: $0.1B — near zero, no signal
Liquidity Signal — Week ending August 12, 2026
Direction: Contracting
Primary Driver: RRP jumped $38.7B — its largest weekly increase in recent memory, erasing the entire three-week decline this series flagged as a pattern last issue
Implication: Reserves fell $55.1B. The TGA added $30.1B on top, its second straight week of refilling after last week’s pullback — both variables moved against reserves together, the first double-barreled week since Issue #22
4-Week Trend: Contracting / Contracting / Expanding / Contracting — the single expanding week didn’t hold; oscillation, not a clean trend, remains the honest read on the last month
What Actually Happened
The RRP is the story this week. After three consecutive declines — $1.4 billion, then $15.7 billion, then $17.7 billion — it jumped $38.7 billion to $358.1 billion, landing above the $354.1 billion level that marked its June peak before that decline began. Whatever pulled money market funds back into the facility this week did more in seven days than the prior three weeks of drawdown combined.
The TGA added to the pressure rather than offsetting it. It rose $30.1 billion to $959.4 billion, a second straight week of refilling after giving back $41.1 billion the week before. The account now sits just $2.9 billion below June’s $956.5 billion local high, and $47.8 billion below the series’ actual peak of $1.007 trillion set back in April.
Reserves absorbed both moves together and fell $55.1 billion — the first week since Issue #22 that the TGA and RRP moved against reserves in the same direction at the same time.
The Mechanics, Briefly
Reserve balances sit in the banking system’s collective account at the Fed. More reserves, more lending and investing capacity. Fewer reserves, less of both.
The TGA is Treasury’s checking account at the Fed. Money flows in from auctions and tax receipts, out through government spending. When the account grows, reserves shrink by roughly the same amount, and vice versa.
The RRP holds cash that money market funds park overnight at the Fed instead of lending it into the banking system. A rising RRP drains reserves; a falling one returns them.
This week: TGA up $30.1B (drain), RRP up $38.7B (drain). Net effect: reserves down $55.1B, with both variables pulling the same direction for the first time in over a month.
The Pattern That Didn’t Survive the Week
Four-week signal history:
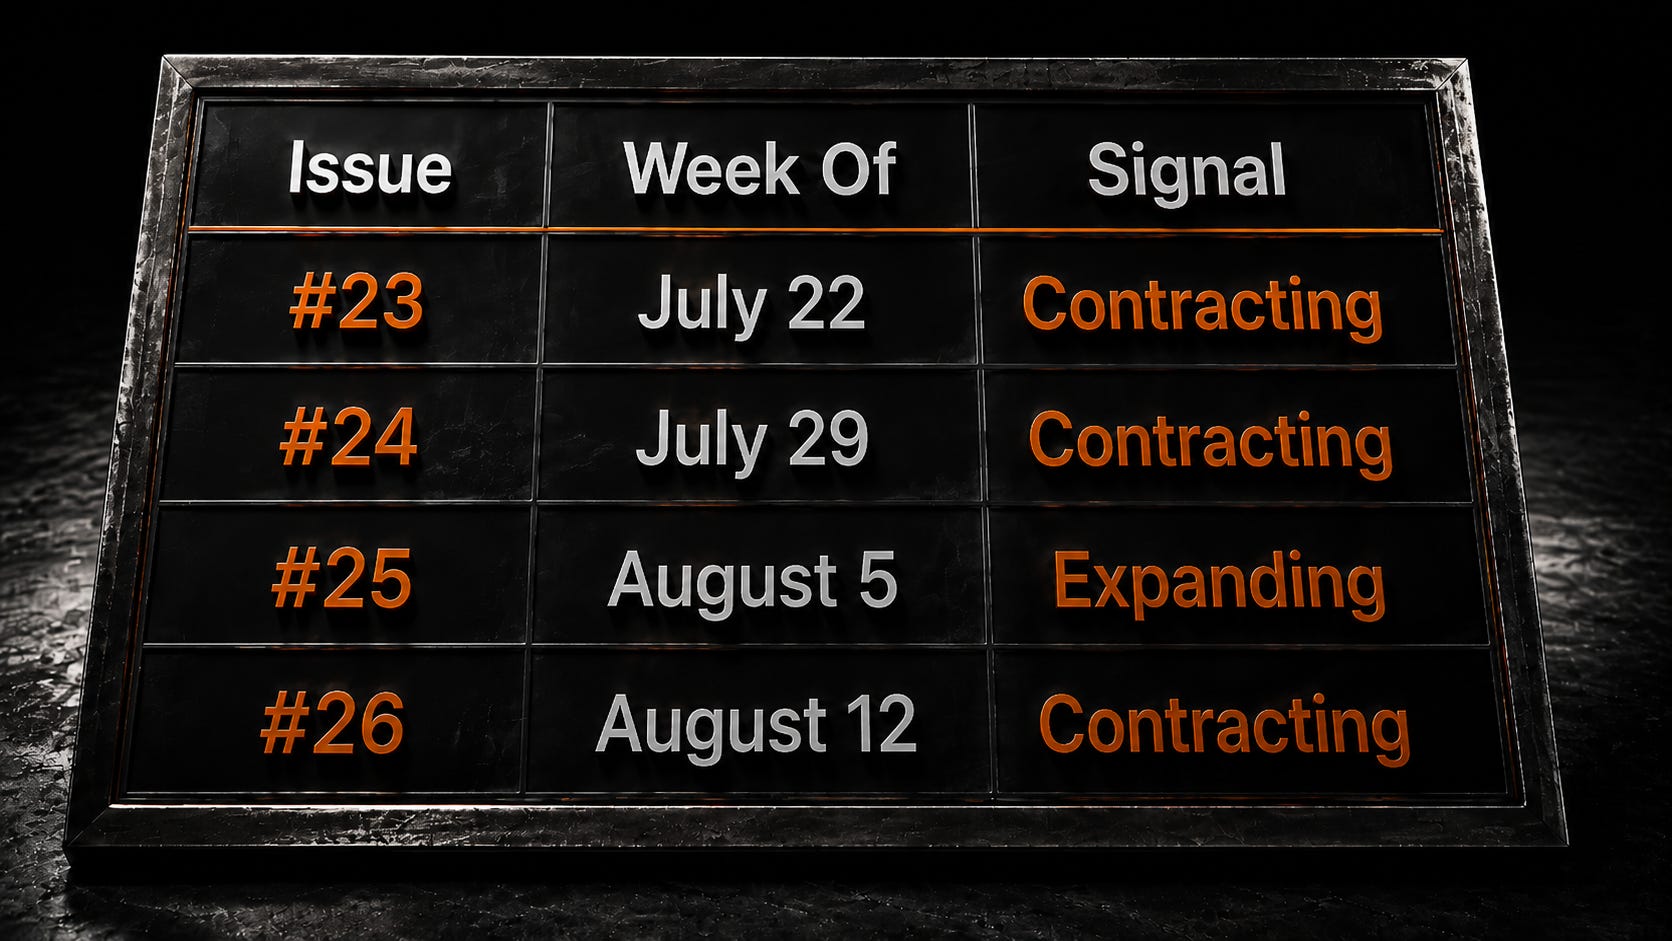
Three contracting weeks, one expanding week, back to contracting. That’s not a trend reversing — it’s a month of oscillation that briefly looked like it was resolving and then didn’t.
The RRP is the clearest example of why this series treats “pattern” claims cautiously even when the data supports one. Three weeks of decline was a real, describable trend last issue. One week of reversal doesn’t erase that those three weeks happened — but it does mean the facility is more volatile in both directions than a three-week sample can capture. The honest update isn’t “the pattern was wrong.” It’s “the pattern was real for three weeks, and this week wasn’t part of it.”
Structural Context: The Ratio
The Claims on Reserves Ratio tracks how many dollars of demandable banking-system claims exist per dollar of reserve buffer. When reserves fall without a commensurate decline in deposits, the ratio rises.
This week: 6.6×. Last week: 6.5×. Reserves fell $55.1 billion while deposits were roughly flat, pushing the ratio back up to where it stood two issues ago.
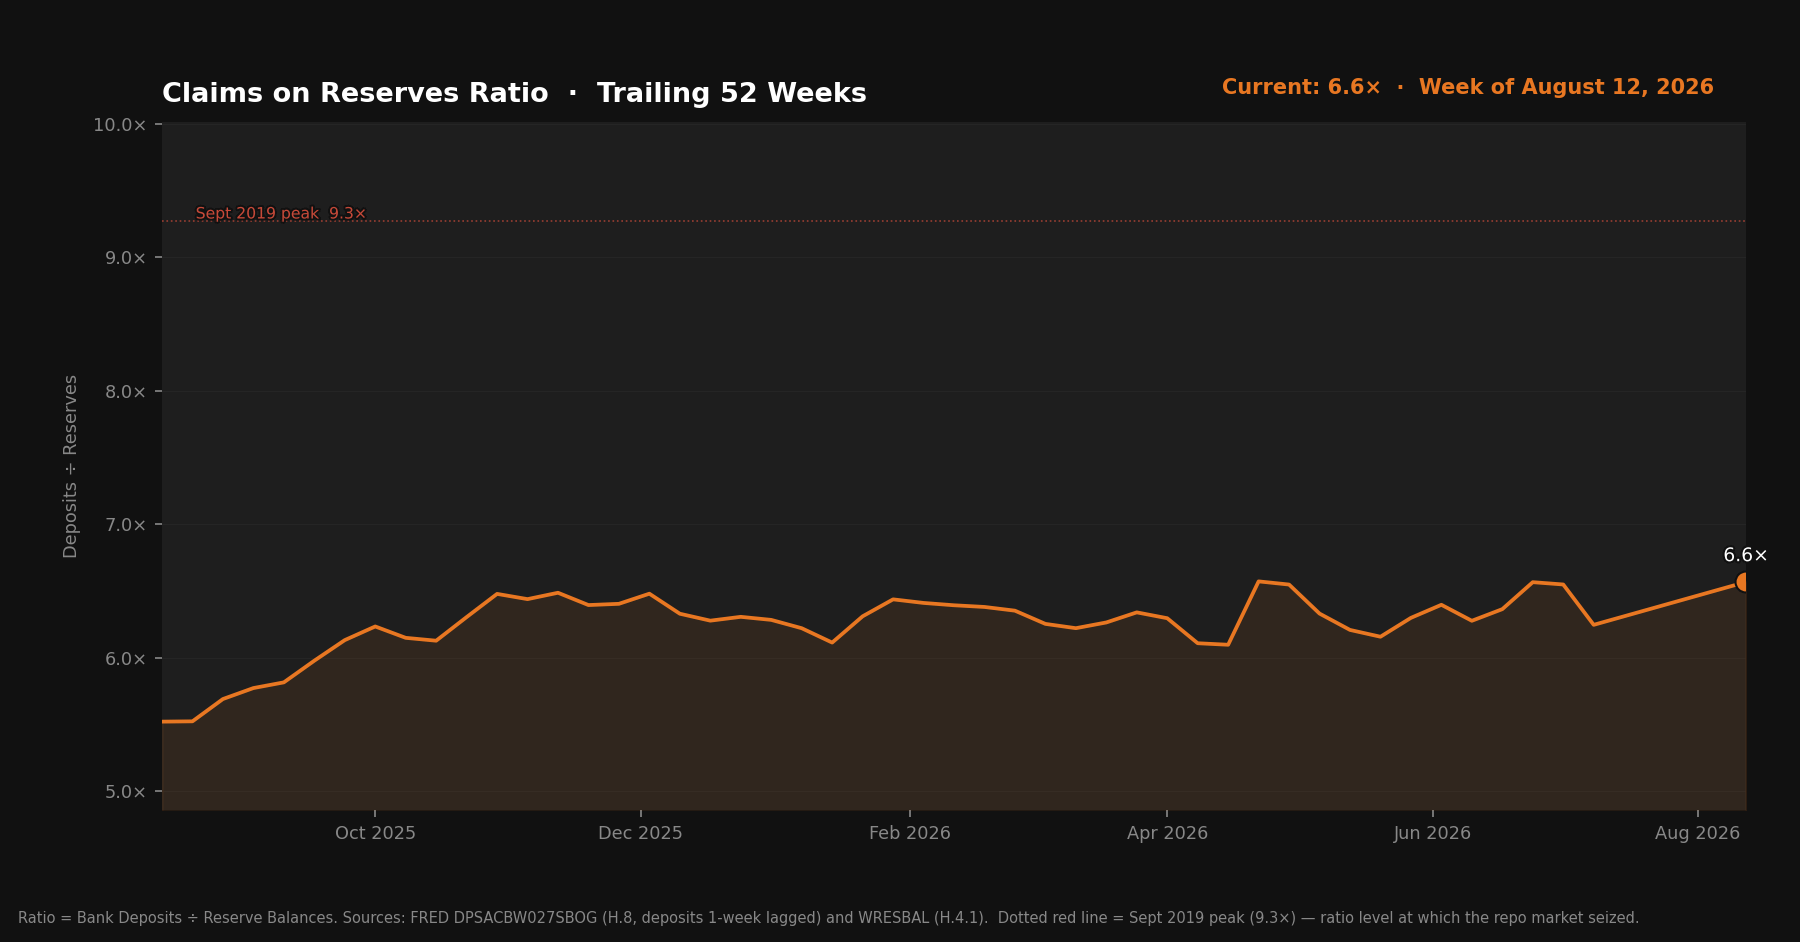
Two issues ago this series asked whether a jump to 6.6× was the start of a faster climb or a one-week spike. Last week’s pullback to 6.5× leaned toward the latter. This week’s bounce back to 6.6× reopens the question rather than answering it. The September 2019 reference level remains roughly 10×, and 6.6× is still meaningful distance from that threshold — but the ratio has now moved in three different directions across three issues, which is its own kind of signal about how unsettled the underlying trend still is.
Deposit data from FRED DPSACBW027SBOG (H.8 release). Due to H.8’s Friday publication schedule, deposits in this issue reflect July 29 data — roughly two weeks behind the August 12 reserve figure.
What to Watch
The RRP’s next move matters more than usual. A second consecutive increase would confirm this week wasn’t a one-off and would put the three-week decline narrative to rest for good. A pullback next week would suggest this week was the outlier instead.
The TGA is now within $3 billion of its June local high, with the true April peak still $47.8 billion further out. Whether it pushes through that June level or stalls here is worth tracking heading into the next issue.
The ratio’s third directional change in three issues is itself the thing to watch. A metric that keeps reversing doesn’t have a clean trend yet, and pretending otherwise would be reading more into three data points than they support.
The Bitcoin Lens
A month of this series now reads as oscillation rather than direction — three contracting weeks, one expanding, back to contracting, with the RRP reversing a three-week pattern in a single move along the way. None of this is a policy shift or a stress event. It’s the ordinary, occasionally noisy mechanics of a government account and a money-market facility that don’t always move in straight lines.
Zoom out and the noise matters less than what’s underneath it. The TGA sits within a few billion dollars of its June high, comfortably above the $300–400 billion range this series treats as normal, funded by debt that creates dollars regardless of which direction the account happens to be moving in any given week.
Bitcoin doesn’t oscillate the way the plumbing does. Its ultimate supply doesn’t move at all, in any direction, in any week. The long-run direction of the dollars is the long-run direction of Bitcoin’s price — whatever the month-to-month noise looks like along the way.
Source: Federal Reserve H.4.1 release, August 13, 2026. Claims on Reserves Ratio uses deposits from FRED DPSACBW027SBOG (H.8 release) and reserve balances from FRED WRESBAL (H.4.1).