

H.4.1 Liquidity Watch Issue // Issue # 17
The TGA and the RRP both moved in the same direction for the first time in a month — and reserves responded by jumping $65.8 billion.


The Weekly H.4.1 Breakdown
Issue #17 — June 11, 2026
Three weeks of contracting signals. Three different stories — a TGA refill, a larger TGA refill, an RRP surge.
This week, all three lines moved the other way.
The TGA drew down $44.6 billion. The RRP declined $8.5 billion. The Fed’s ongoing purchases added another $9.8 billion in T-bill holdings. Reserves jumped $65.8 billion. The streak is broken.
Quick Update — Week ending June 10, 2026
Four rows from Table 1, Wednesday column:
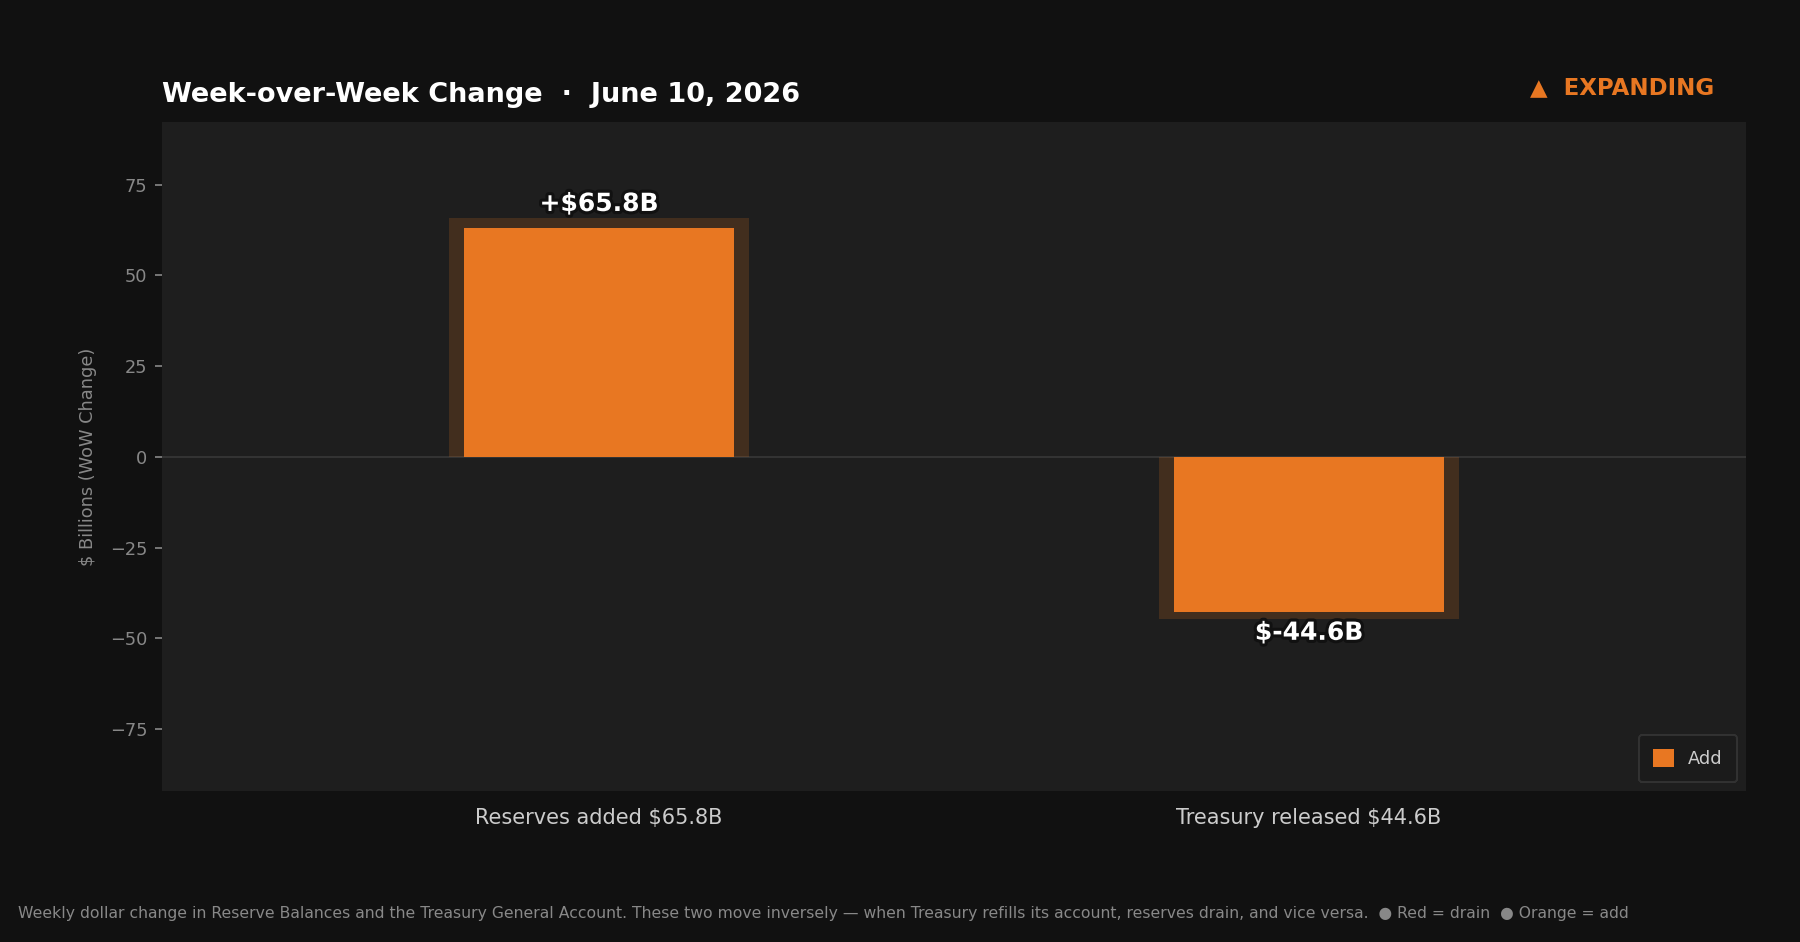
Reserve balances with Federal Reserve Banks: $3,111.5B — up $65.8B from last week
U.S. Treasury General Account (TGA): $801.1B — down $44.6B from last week
Reverse repurchase agreements (RRP): $317.3B — down $8.5B from last week
Central bank liquidity swaps: $0.0B — near zero, no signal
Liquidity Signal — Week of June 10, 2026
Direction: Expanding
Primary Driver: TGA drew down $44.6B — Treasury spending pushed reserves up sharply
Implication: First expanding signal in four weeks; RRP decline added a secondary tailwind; reserves jumped $65.8B
4-Week Trend: Contracting 3 of 4 weeks — one expanding signal this week breaks the streak.
What Actually Happened
The TGA ended the week at $801.1 billion — down $44.6 billion from last week’s $845.7 billion. Treasury spent, and the banking system received it.
When Treasury draws from its account at the Fed, that money doesn’t disappear. It becomes reserve balances at commercial banks. Every payroll payment, every federal contract, every benefit disbursement that flows from Treasury’s account flows directly into someone’s bank account — and that bank’s reserve balance rises as a result. A $44.6 billion drawdown is a $44.6 billion direct injection into banking system capacity.
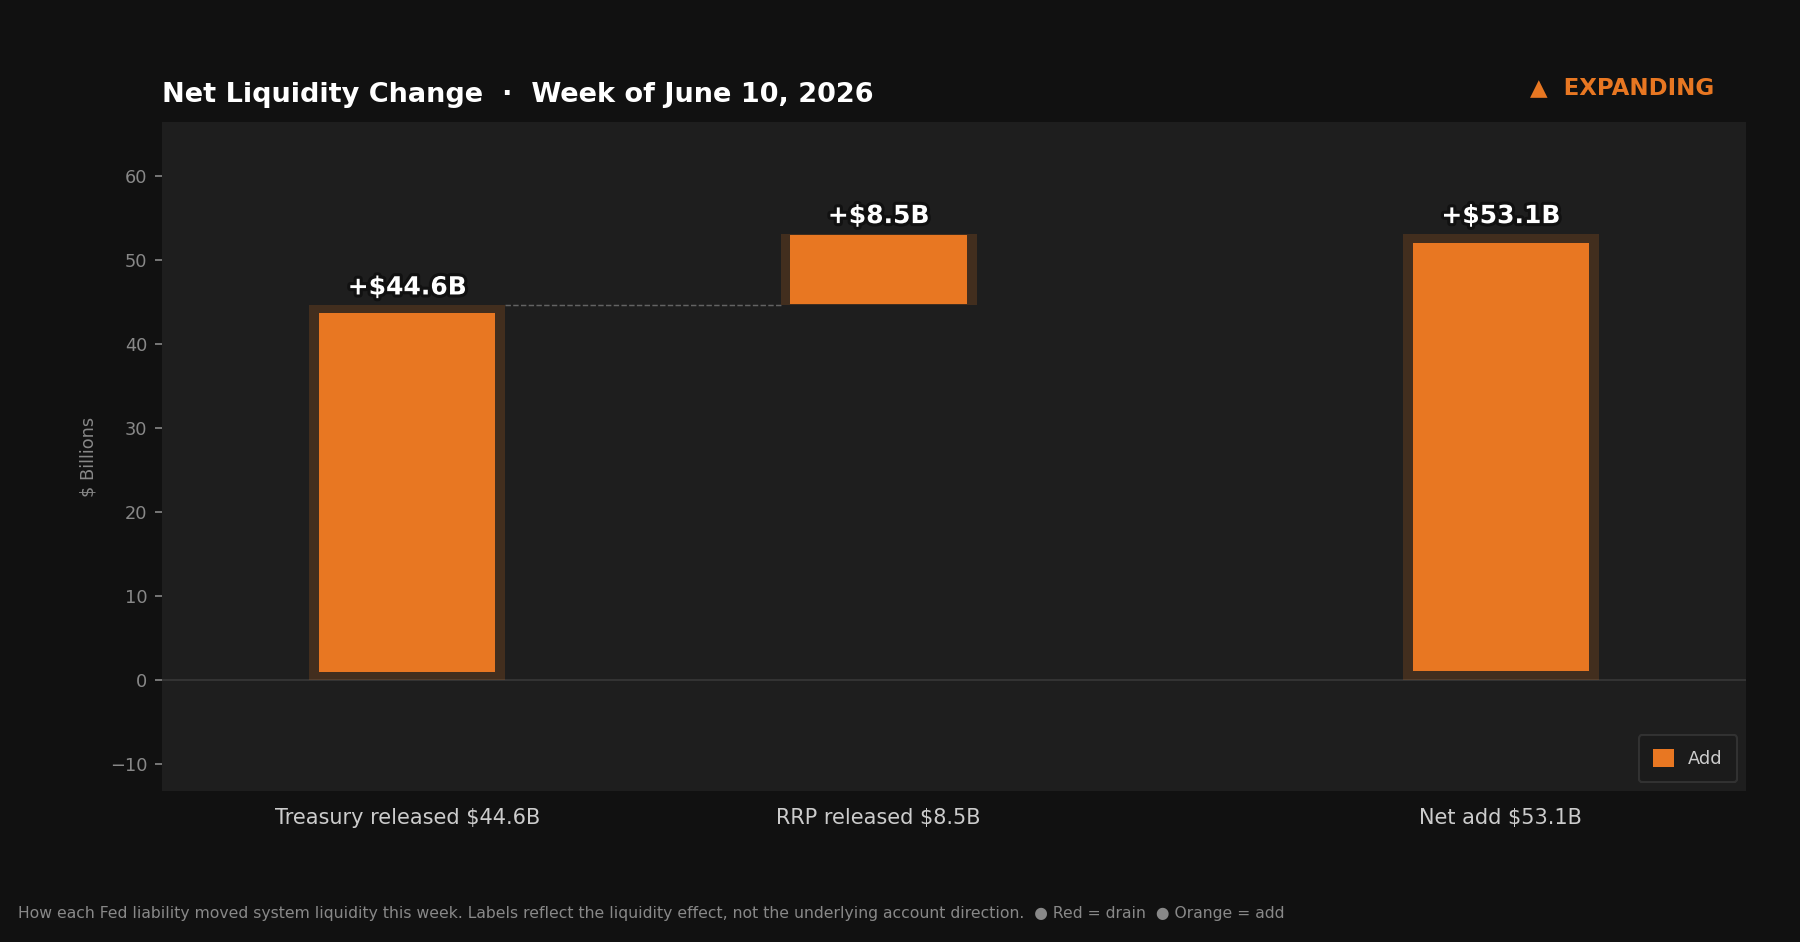
The RRP added a secondary tailwind. Last week the overnight facility held $325.8 billion. This week it sits at $317.3 billion — down $8.5 billion. Money that was parked at the Fed overnight returned to the broader system. Combined with the TGA drawdown, the gross expansionary flows reach $53.1 billion before any offsets.
The Fed’s ongoing T-bill purchases ran quietly alongside both moves. T-bill holdings rose $9.8 billion to $479.3 billion. Total securities held outright (SOMA) now stands at $6.447 trillion. The full math: $53.1 billion from TGA and RRP, plus roughly $9.8 billion from T-bill purchases, gets you to about $62.9 billion — against an actual reserve jump of $65.8 billion. The remaining gap is rounding and minor other factors.
Net liquidity in the financial system, combining Treasury cash balances and reverse repo usage.
The Mechanics, Briefly
For readers joining this series for the first time:
Reserve balances are what commercial banks hold at the Fed — the banking system’s collective checking account. When reserves rise, banks have more capacity to lend and invest. When reserves fall, that capacity tightens.
The TGA is the federal government’s checking account at the Fed. Tax receipts flow in; government spending flows out. When Treasury spends, money leaves its account and enters the banking system as reserves. When Treasury refills, money flows the other direction. The TGA and reserves sit at opposite ends of the same seesaw.
The RRP is an overnight facility where money market funds park cash at the Fed. Dollars sitting there are not in general circulation. When RRP falls, that money returns to the broader system. When RRP rises, that money exits.
This week: the TGA shed $44.6 billion. The RRP shed $8.5 billion. T-bill purchases added approximately $9.8 billion. Reserves rose $65.8 billion.
Reserve Balances and the Treasury General Account move inversely — when Treasury refills its account, reserves drain, and vice versa.
The Fed’s Two Hands
Most coverage of the Fed focuses on the rate decision. That hand has been stationary.
Since December 12, 2025, the Fed has been conducting Reserve Management Purchases — buying Treasury bills to manage the size of its balance sheet. The program launched at roughly $40 billion per month in T-bill purchases, but that pace has slowed meaningfully in recent months. The $53 to $55 billion monthly total that combined those purchases with MBS reinvestment of approximately $13 to $15 billion reflected the program’s early run rate, not a consistent ongoing figure.
These purchases don’t appear in the TGA or RRP lines tracked in this report. They land on the asset side of the Fed’s balance sheet, in T-bill holdings — which reached $479.3 billion this week, up $9.8 billion from last week’s $469.5 billion. Total securities held outright (SOMA) stands at $6.447 trillion. The $9.8 billion weekly move is a data point, not a projection; the pace varies and has been lower in recent weeks.
This week, the RMPs were the smallest of the three contributing forces. The TGA and RRP did the heavy lifting. The Fed’s purchases added consistency where the fiscal side provided the momentum.
What to Watch
The TGA at $801.1 billion remains elevated — down from last week’s $845.7 billion but still high relative to the levels earlier this year. Whether Treasury continues spending from that balance or begins to refill determines whether next week’s signal holds or reverses. The RRP, which we flagged last week as a quarter-end wildcard, declined this week rather than rising further — worth watching as June 30 approaches to see whether seasonal pressure rebuilds in the final two weeks of the quarter. A renewed RRP surge heading into month-end would offset some or all of the TGA tailwind.
The Bitcoin Lens
A $65.8 billion jump in reserves doesn’t change the long-run picture. It’s a week. The contracting signals before it were weeks too.
What this report tracks — across all the weeks, all the directions — is the constant motion of a system that requires more dollars to function. The TGA fills and empties because the government spends and collects. The RRP rises and falls because money market funds are always looking for overnight returns. The Fed buys T-bills to keep reserve balances in the banking system from falling too low. Every one of these mechanisms produces dollar flows.
This week produced a lot of them. Next week might reverse some. Quarter-end is three weeks out.
The key is that total dollars in the system trend in one direction over time. Bitcoin’s supply does not move at all. Watching the plumbing can help navigate weeks and months, but the long-run direction of the dollars is the long-run direction of Bitcoin’s price.