



On August 19, the U.S. Treasury announced it’s roughly doubling the size of its long-bond buyback operations. More evidence of the Treasury being the de facto monetary authority instead of the Fed, but I digress. This goes effective on September 9, but long yields fell immediately. Bitcoin ran from a $64.1k intraday low to nearly $69.8k in a matter of hours. Now sitting at about $78k as I write this. That’s the headline. The rest of this issue is about whether it means what it looked like it meant.
The Bid Nobody Scheduled
What actually happened
Treasury’s program of periodic purchases of older, less-liquid securities has existed for a while. However, its main purpose has been to support market functioning, not to move interest rates.
On August 19, Treasury announced it’s expanding the size of those operations for the 10-to-20-year and 20-to-30-year sectors, from a $2 billion per-operation cap to at least $4 billion, running from September 9 through November 4.
Future sizing gets revisited at the November 4 Quarterly Refunding. The stated reason: those sectors have shown “consistent strong sponsorship” (Treasury-speak for saying there’s reliable demand when they show up to buy.)
The market reaction was immediate and large for a program this administratively small. The 30-year yield fell about 9 basis points to roughly 5.196%, a day after touching 5.33% which was the highest since June 2007. The 10-year fell about 5.7 basis points to 4.647%. The dollar weakened. Equities rebounded.
And then there’s my favorite asset ever, Bitcoin. The orange coin was chillin well below $65k, and a day later it’s at $73k, marking its first print above $69k since early June. Something like $2 billion in short positions got liquidated over 24 hours, $1.2 billion of it in a single hour.
Seems like a bit of a disproportionate reaction for a program that will buy at most, an extra $2 billion per operation against a roughly $30 trillion Treasury market.
Why this isn’t QE, and the reason is specific
The instinct here is to call this quantitative easing with a different name and that instinct has a real pedigree. Joseph Wang made a version of this argument back in 2023 and I believe it’s wrong for a specific, checkable reason.
The 2023 mechanism worked like this: if Treasury funds a buyback by issuing new bills, and money market funds buy those bills using cash they’d otherwise been parking overnight at the Fed’s reverse repo facility, then cash that had been sitting inert at the Fed moves out into the banking system to pay off the seller of the old bond. Money that was doing nothing starts doing something. That’s functionally similar to what QE does, even though the Fed isn’t the one buying.
That mechanism needs one thing to exist: a reverse repo facility with real cash sitting in it, ready to be drained. It doesn’t have that anymore. I pulled this week’s H.4.1 report to check directly, and the split matters more than the headline number. The “reverse repurchase agreements” line I’ve tracked as “RRP” throughout this series has actually been dominated by foreign central banks parking cash at the Fed instead of domestic money market funds. This week that foreign balance sits at $373.4 billion.
The line that actually matters for Wang’s argument is the domestic side, labeled “Others” in the Fed’s own table. This is where money market fund cash would sit. It sits at a paltry $317 million. Effectively zero. It’s been near zero since I started tracking H.4.1 data in March.
I need to touch on that a second because I’ve been calling the total line “RRP” every week and describing it as money market funds parking cash. That was imprecise. The number itself has been right. A rising total drains reserves, a falling one returns them, and that mechanical relationship holds regardless of who’s using the facility. It’s the “who” that’s been inaccurate. Going forward I’ll be more careful to separate the two.
With the domestic side already empty, there’s no reservoir left to drain. What Treasury is actually doing is a maturity swap: duration out of the market, short-term bills in. Boockvar’s framing is the accurate one — a rearrangement of the debt’s maturity schedule, not new money.
The real channel, and it’s a Howell channel
If it’s not reserve creation, what is it? The honest answer requires a different lens than the one most coverage reached for.
Roughly three-quarters of global lending runs on collateral rather than deposits. In Michael Howell’s framework — the one I lean on for my broader liquidity thesis — the binding constraint on the financial system usually isn’t “how much money exists.” It’s how much collateral is sitting around that’s good enough to borrow against, and how much of a discount (a “haircut,” in the industry’s term) lenders demand before they’ll accept it. Impaired collateral shrinks how much anyone can borrow against it, which shrinks the system’s capacity to fund itself, independent of the deposit-based money supply. Read that last sentence again and study it. It’s essentially the essence of how the global financial system works at the highest level.
Long-dated Treasuries had become impaired collateral. A 30-year bond issued in May 2020 was trading around 45 cents on the dollar as of August 19 because a 30-year bond bought at 2020 yields is worth much less once yields nearly triple. Simple math, yields up = value down. And the value goes down by a greater degree the longer the duration. A predictable official buyer showing up in that sector does two things without touching bank reserves at all: it puts a floor under the worst-marked collateral’s value, and it takes some of that duration off dealers’ balance sheets, freeing up capacity they’d otherwise have tied up holding it.
An IMF working paper from 2025 studied the buyback program’s first year and found the effect real but modest — something like a 0.2 basis point decline in spreads and a 10-cent price improvement on the securities Treasury targeted, with dealer inventories of bills and coupons falling by roughly $1.5 billion over six weeks. Those are the honest numbers. They describe a program that eases friction at the margin, not one that reflates a balance sheet.
The counter-nuance that keeps this honest
Before this reads like a crisis story, it’s worth naming what it isn’t. The MOVE index — bond markets’ version of the VIX, a gauge of how much volatility traders expect — has actually been falling. As of the week of August 17 it sat around the 36th percentile of its historical range, down from the 89th percentile just two weeks earlier. That’s happening at the same time the 30-year hit a two-decade high in yield.
That combination matters. If bond volatility were spiking alongside the yield spike, this would look like a systemic collateral crisis that forces emergency intervention. Instead, this was a term-premium and supply problem isolated at the long end of the curve, not a broad breakdown in how Treasuries function as collateral everywhere. That distinction caps how much the collateral channel above can actually do. It’s a narrow fix for a narrow problem.
Why it registered as a shock anyway
The program itself is too small to move markets on flow alone. Three things made it land as more than a small operational tweak.
First, timing. This wasn’t announced at a scheduled refunding — it landed between them, one day after the 30-year hit its highest yield since 2007, heading into a $16 billion 20-year auction. Nothing about the calendar suggested Treasury would act that week.
Second, it crosses a line Treasury’s own advisors had drawn. The Treasury Borrowing Advisory Committee’s stated position, as of July 2025, was that buybacks are appropriate for smoothing market functioning but not for reshaping debt composition to manage where yields sit. Mohamed El-Erian’s read was blunt: small relative to net issuance, but really a step toward yield curve control by another name.
Third — and this is the actual thesis of this piece — a reaction function got written down in public. Bitcoin didn’t move because of $2 billion a week in flow. It moved because the market read a confirmation: the fiscal authority will not sit still while a 5.3% thirty-year yield coexists with a monetary authority still trying to tighten. That’s fiscal dominance, the idea Luke Gromen has been tracking for years — the point where the government’s own borrowing costs start dictating policy more than inflation targets do — showing up in the open rather than as a theory.

It’s also not a one-off. In July, Treasury used its own funds to support the yen by selling euros, not dollars. There’s been a push to let the Fed expand a facility that lets Japan lend against its Treasury holdings instead of selling them outright. Now this. Three separate interventions, all pointing at the same underlying posture: when a market at the edge of the system looks like it’s breaking, someone with a balance sheet shows up.
Is any of this durable?
Split the question into two, because they have different answers. The price move: probably not, on its own. The signal about how policy will behave under pressure: yes.
The case against durability is long. The rally didn’t happen in a vacuum — the SEC’s proposed crypto offering framework landed the same day, alongside a weaker dollar and Fed minutes, and any version of this piece that credits the buyback alone for a $10k-plus move in Bitcoin is overclaiming something the data can’t support. It also looks like a squeeze off an oversold base and lots of short leverage, and that kind of fuel burns fast. More specifically: the move doesn’t look funded. Stablecoin supply sitting on exchanges is down roughly $14 billion since May, and the ratio of Bitcoin’s market cap to stablecoin supply has climbed from 9.82 to 11.69 since late June — well off this year’s high of 12.83 in January, but climbing, which means there’s proportionally less stablecoin cash on the sidelines relative to Bitcoin’s size than there was a couple months ago. Less dry powder waiting to keep buying. Nothing about deficits, inflation, foreign demand for Treasuries, or the pace of issuance changed on August 19. And this isn’t a U.S.-only story — Japan’s 10-year sits at a three-decade high, German 30-year bunds are at their highest since 2011, French 30-years since 2008. A U.S. Treasury buyback program doesn’t touch any of that. The program itself expires November 4 and needs an explicit renewal to continue.
The case for durability is shorter but not nothing. A put, once written, doesn’t decay the way a short squeeze does — the market now knows what the fiscal authority will tolerate, and that knowledge doesn’t expire with the rally. The first actual operation is September 9, which is still ahead of us, not behind. And November 4 is a real, dated checkpoint with a binary outcome: renewed, expanded, or allowed to lapse.
The part I’m not going to resolve
Here’s a tension worth naming rather than smoothing over. Price moved on August 19. The actual buying doesn’t start until September 9. I have spent many months using Michael Howell’s roughly-13-week lag between a liquidity signal and its effect on risk assets. Run that lag from September 9 and the confirming liquidity impulse, if there is one, lands in early December.
The market front-ran its own mechanism by most of a quarter. That’s either a market correctly pricing in information ahead of the mechanical flow, or it’s a market that got ahead of itself and will need to digest that gap before the actual operations catch up. I don’t know which, and I’d rather say that plainly than force a conclusion the timeline doesn’t support yet.
The Balance Sheet This Is Landing On
This week’s H.4.1 report covers the week ending Wednesday, August 19 — the announcement itself. The first buyback operation doesn’t happen until September 9. Whatever this week’s numbers show, they show zero buyback effect. What they do show is the balance sheet the announcement is about to land on, which makes the regular weekly numbers this issue’s setup rather than an afterthought.
Quick Update — Week ending August 19, 2026
Four rows from Table 1, Wednesday column:
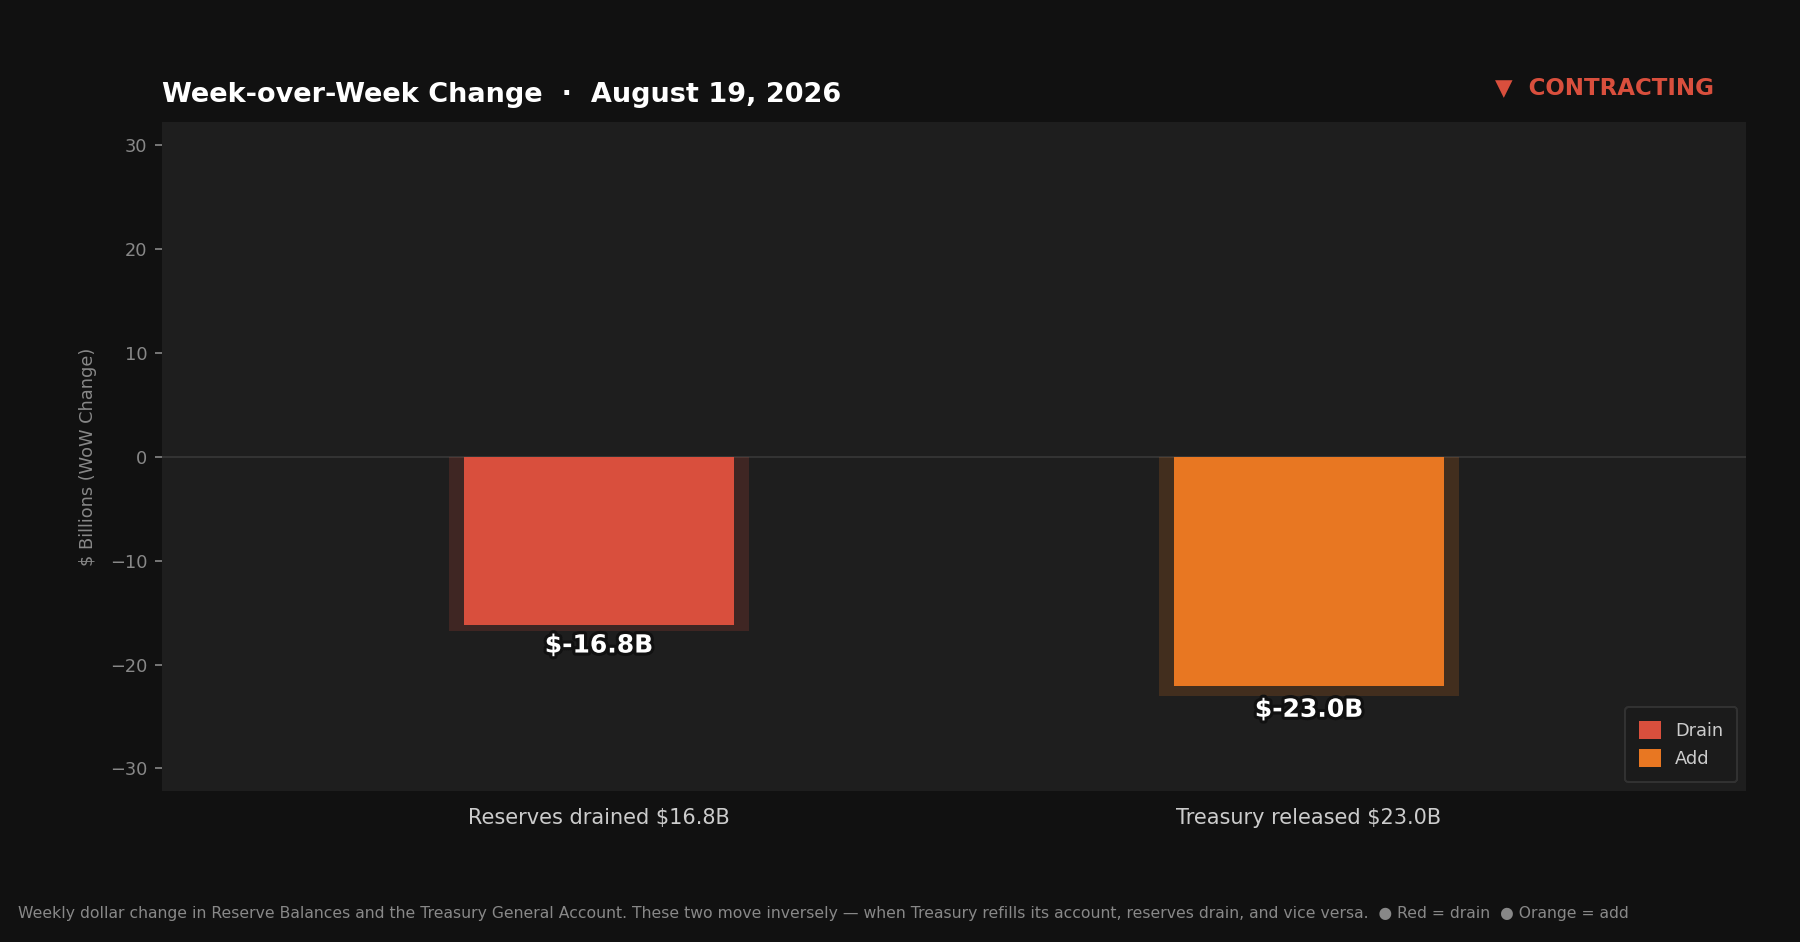
Reserve balances with Federal Reserve Banks: $2,930.8B (~$2.931T) — down $16.8B from last week
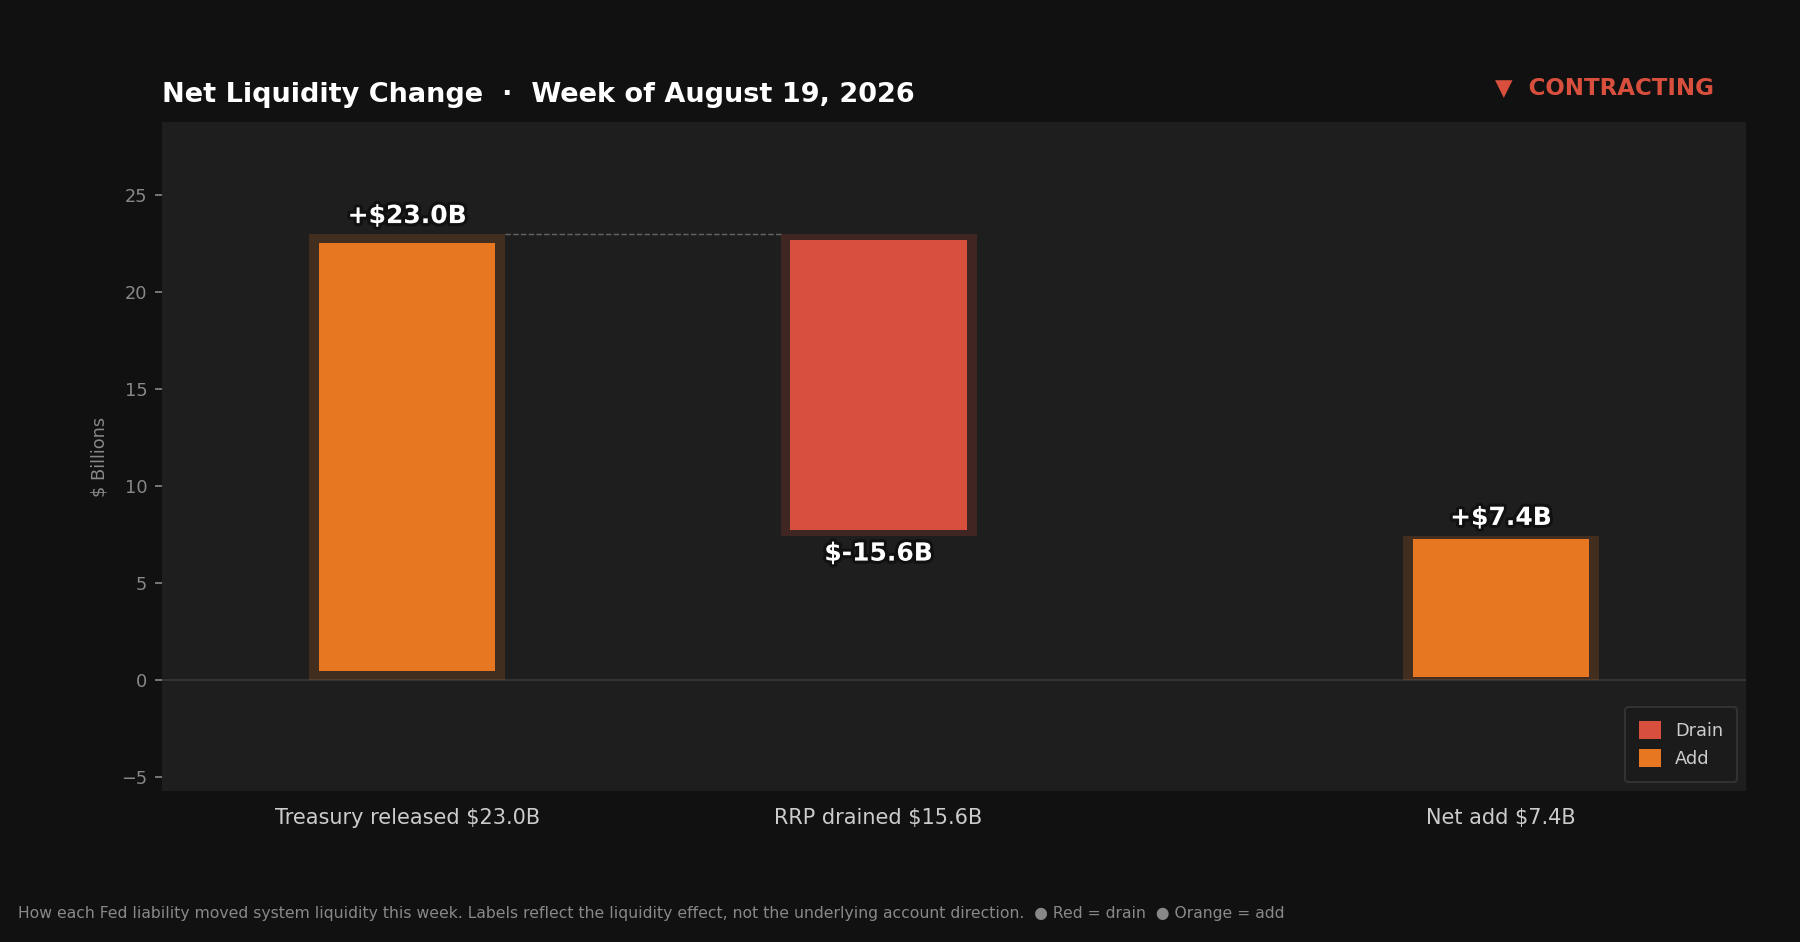
U.S. Treasury General Account (TGA): $936.4B — down $23.0B from last week
Reverse repurchase agreements (RRP): $373.7B — up $15.6B from last week
Central bank liquidity swaps: $0.1B — near zero, no signal
Liquidity Signal — Week ending August 19, 2026
Direction: Contracting
Primary Driver: An unusual combination — TGA fell $23.0B, which normally injects reserves, but RRP rose $15.6B and roughly $24B more drained through other balance sheet items than the TGA/RRP math alone explains
Implication: Reserves fell $16.8B despite the TGA drawdown, the first week this series has seen the TGA spend while reserves fell anyway
4-Week Trend: Contracting / Expanding / Contracting / Contracting — three signal change in four issues; Even with two consistent signals this continues to read as oscillation, not direction
What Actually Happened
Start with the part that doesn’t fit the usual pattern. The TGA fell $23.0 billion this week, to $936.4 billion — ordinarily that’s an injection, Treasury spending down its account and pushing cash back into the banking system. Reserves should have risen. They didn’t. They fell $16.8 billion instead.
Two things account for the gap. First, the RRP — the total reverse repo line, which as covered above is now almost entirely foreign official accounts rather than domestic money market funds — rose $15.6 billion to $373.7 billion, itself a drain. Second, and smaller in a single week but worth flagging: the rest of the Fed’s balance sheet moved against reserves by roughly $24 billion more than the TGA and RRP explain together. I checked whether this is the “Reserve Management Purchases went to zero” story starting to show up structurally — it’s the first full week since RMPs stopped on August 14. It cleanly isn’t. Securities held outright actually rose $3.8 billion this week, not the outright balance-sheet shrinkage that would confirm QT biting harder without RMP offset. The bulk of the gap traces to a volatile “other assets” line that fell $17.2 billion, which reads more like normal accrual-timing noise than a structural shift. Worth another week or two of data before calling this a trend.
The Standing Repo Facility — the tool primary dealers use when reserves genuinely get scarce — showed $1 million in usage this week. Essentially nothing. If reserves were actually getting tight, that’s the number that would move first. It hasn’t.
TGA is now $936.4 billion — $20.1 billion below June’s $956.5 billion local high, and $70.8 billion below this series’ actual peak of $1.007 trillion from April.
The Mechanics, Briefly
Reserve balances sit in the banking system’s collective account at the Fed. More reserves, more lending and investing capacity. Fewer reserves, less of both.
The TGA is Treasury’s checking account at the Fed. Money flows in from auctions and tax receipts, out through government spending. When the account grows, reserves shrink by roughly the same amount, and vice versa.
The RRP, as this issue corrects above, is mostly foreign central banks and international accounts parking cash overnight at the Fed — not domestic money market funds, whose usage of the facility has been near zero for months. A rising RRP still drains reserves and a falling one still returns them, regardless of who’s on the other side of it; only the “who” needed fixing, not the mechanics.
This week: TGA down $23.0B (would normally inject), RRP up $15.6B (drain), plus roughly $24B in additional drain from elsewhere on the balance sheet. Net effect: reserves down $16.8B — a case where the usual TGA-driven read wasn’t the whole story.
Four Signals, Four Directions
Two contracting weeks now in a row, but this one and last week’s don’t share a mechanism. Issue #26 was TGA and RRP both draining together. This week the TGA was actually trying to inject, and got overridden by the RRP and by balance-sheet items this series doesn’t usually have to discuss. The ratio moved too — 6.7× this week, up from 6.6× last week, continuing a slow drift that’s now spanned four different directions across four issues. None of it is dramatic. All of it is worth logging precisely rather than rounding into a story that isn’t there yet.
What to Watch
How this gets funded. Treasury didn’t say, and that’s the question that actually decides whether any of this reaches reserves. If the buybacks are funded with bills against a TGA drawdown, that’s reserve-positive on top of the collateral relief. If they force heavier bill issuance into a TGA rebuild instead, the drain from refilling the TGA offsets the collateral benefit, and the two effects partly cancel out. This series is tracking TGA and reserves every week anyway — it’s positioned to actually answer this over the next eight weeks, as the September 9 operations start showing up in the data.
September 9 — offered versus accepted. The first buyback operation happens here. If Treasury accepts near the new $4 billion cap, the ceiling itself is the binding constraint and November 4 becomes a question of raising it further. If accepted volume stays well below the cap, the announcement was more signal than substance, and that’s a fair thing to say plainly once the data’s in.
TGA and reserves, together, weekly. This week broke the usual pattern where TGA direction predicts reserve direction. Whether that was a one-week anomaly or the start of RMPs-off making the relationship noisier is worth tracking issue to issue.
30-year term premium and the MOVE index. Watch whether they keep diverging — yields staying elevated while volatility keeps falling — or start moving together, which would change the “isolated, not systemic” read this issue leans on.
SRF usage. Still near zero this week. Any real uptick is the earliest tell that reserves are getting scarce without RMPs to backstop them.
Stablecoin supply and the SSR. Whether the ratio keeps climbing (less funded, more fragile rally) or reverses (fresh cash actually arriving) says more about whether this move holds than the buyback mechanics do.
November 4 — the Quarterly Refunding. Binary and dated: renewal, expansion, or expiry. This is the checkpoint that turns “signal” into either “policy” or “one-off.”
The Bitcoin Lens
Be precise about what actually happened here, because overclaiming would undercut the point. Bitcoin didn’t rally because Treasury will buy an extra $2 billion of 20-year bonds a week — that’s not enough flow to move an asset this size. It rallied alongside a weaker dollar, an SEC proposal landing the same day, and a market reading confirmation that the fiscal side of government won’t tolerate a 5.3% thirty-year yield indefinitely while the Fed stays tight. Untangling how much belongs to each of those is genuinely not possible from the outside, and I’m not going to pretend otherwise.
What is worth holding onto: this is the third time in recent months that a market under stress got met with a balance-sheet response from somewhere in the government rather than being left to clear on its own. Yen support in July. A facility change under discussion for Japan’s Treasury holdings. Now long-end buybacks. The specific mechanism changes each time. The posture of *“someone with a balance sheet shows up” doesn’t.
That posture is the actual throughline to this series’ thesis, more than any single week’s TGA or RRP number. A government that manages its own borrowing costs when they get uncomfortable is a government that will keep finding ways to add dollars to the system, through whichever channel is available that week. Bitcoin’s supply doesn’t respond to any of those channels. It doesn’t negotiate with the dollar. It just absorbs it — on whatever the actual lag turns out to be, not the one the market priced in on August 19.
Source: Federal Reserve H.4.1 release, August 20, 2026, and U.S. Treasury press release SB0607, August 19, 2026. Claims on Reserves Ratio uses deposits from FRED DPSACBW027SBOG (H.8 release) and reserve balances from FRED WRESBAL (H.4.1).